

What the dashboard is
The dashboard is where you store data and findings as you work through a search. It works like a shopping basket on a retail site. As soon as it holds some data, you can open it and change its contents to suit your needs. You fill the dashboard in one of two ways:- Add data manually from the Explore tab.
- Run a pre-set template. See Templates.
Add data to the dashboard
Every section in Explore lets you add to your dashboard.- Single tiles: Click the purple plus icon on a tile.
- Lists: Select the check boxes for the items you want, then click Add to dashboard at the bottom of the panel. To add every result from a search, click Add to dashboard without selecting anything.
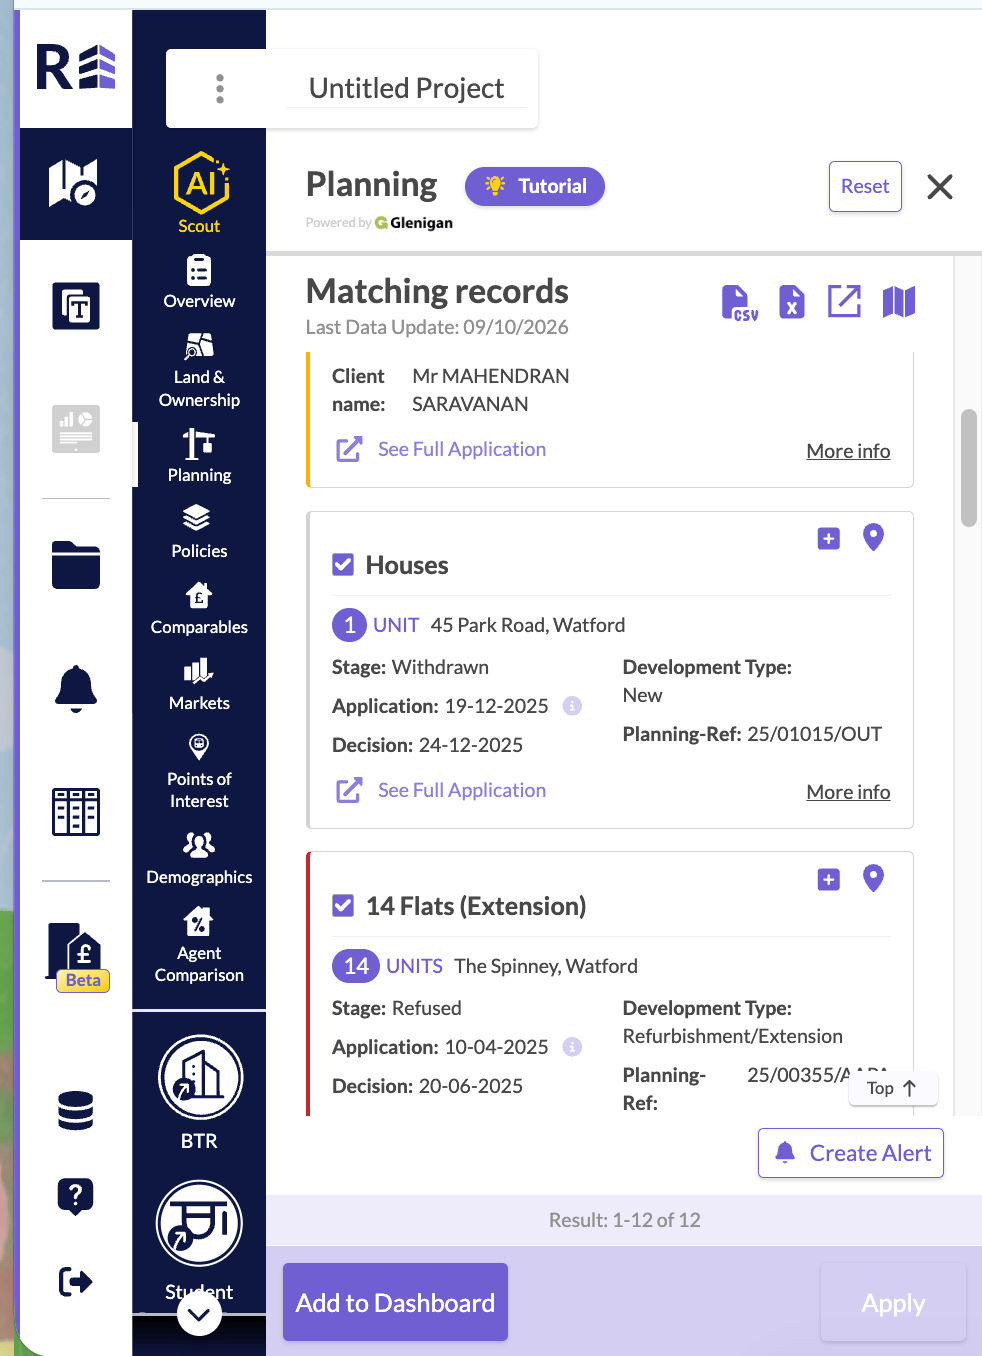
Each record has a plus icon, and Add to Dashboard sits at the bottom of the panel.
Customise your dashboard
Open your dashboard from the left sidebar. You can then:- Move tiles or change their size.
- Add or remove sections to break your data down the way you need.
- Save the dashboard as a template, so you can reuse it for another location.
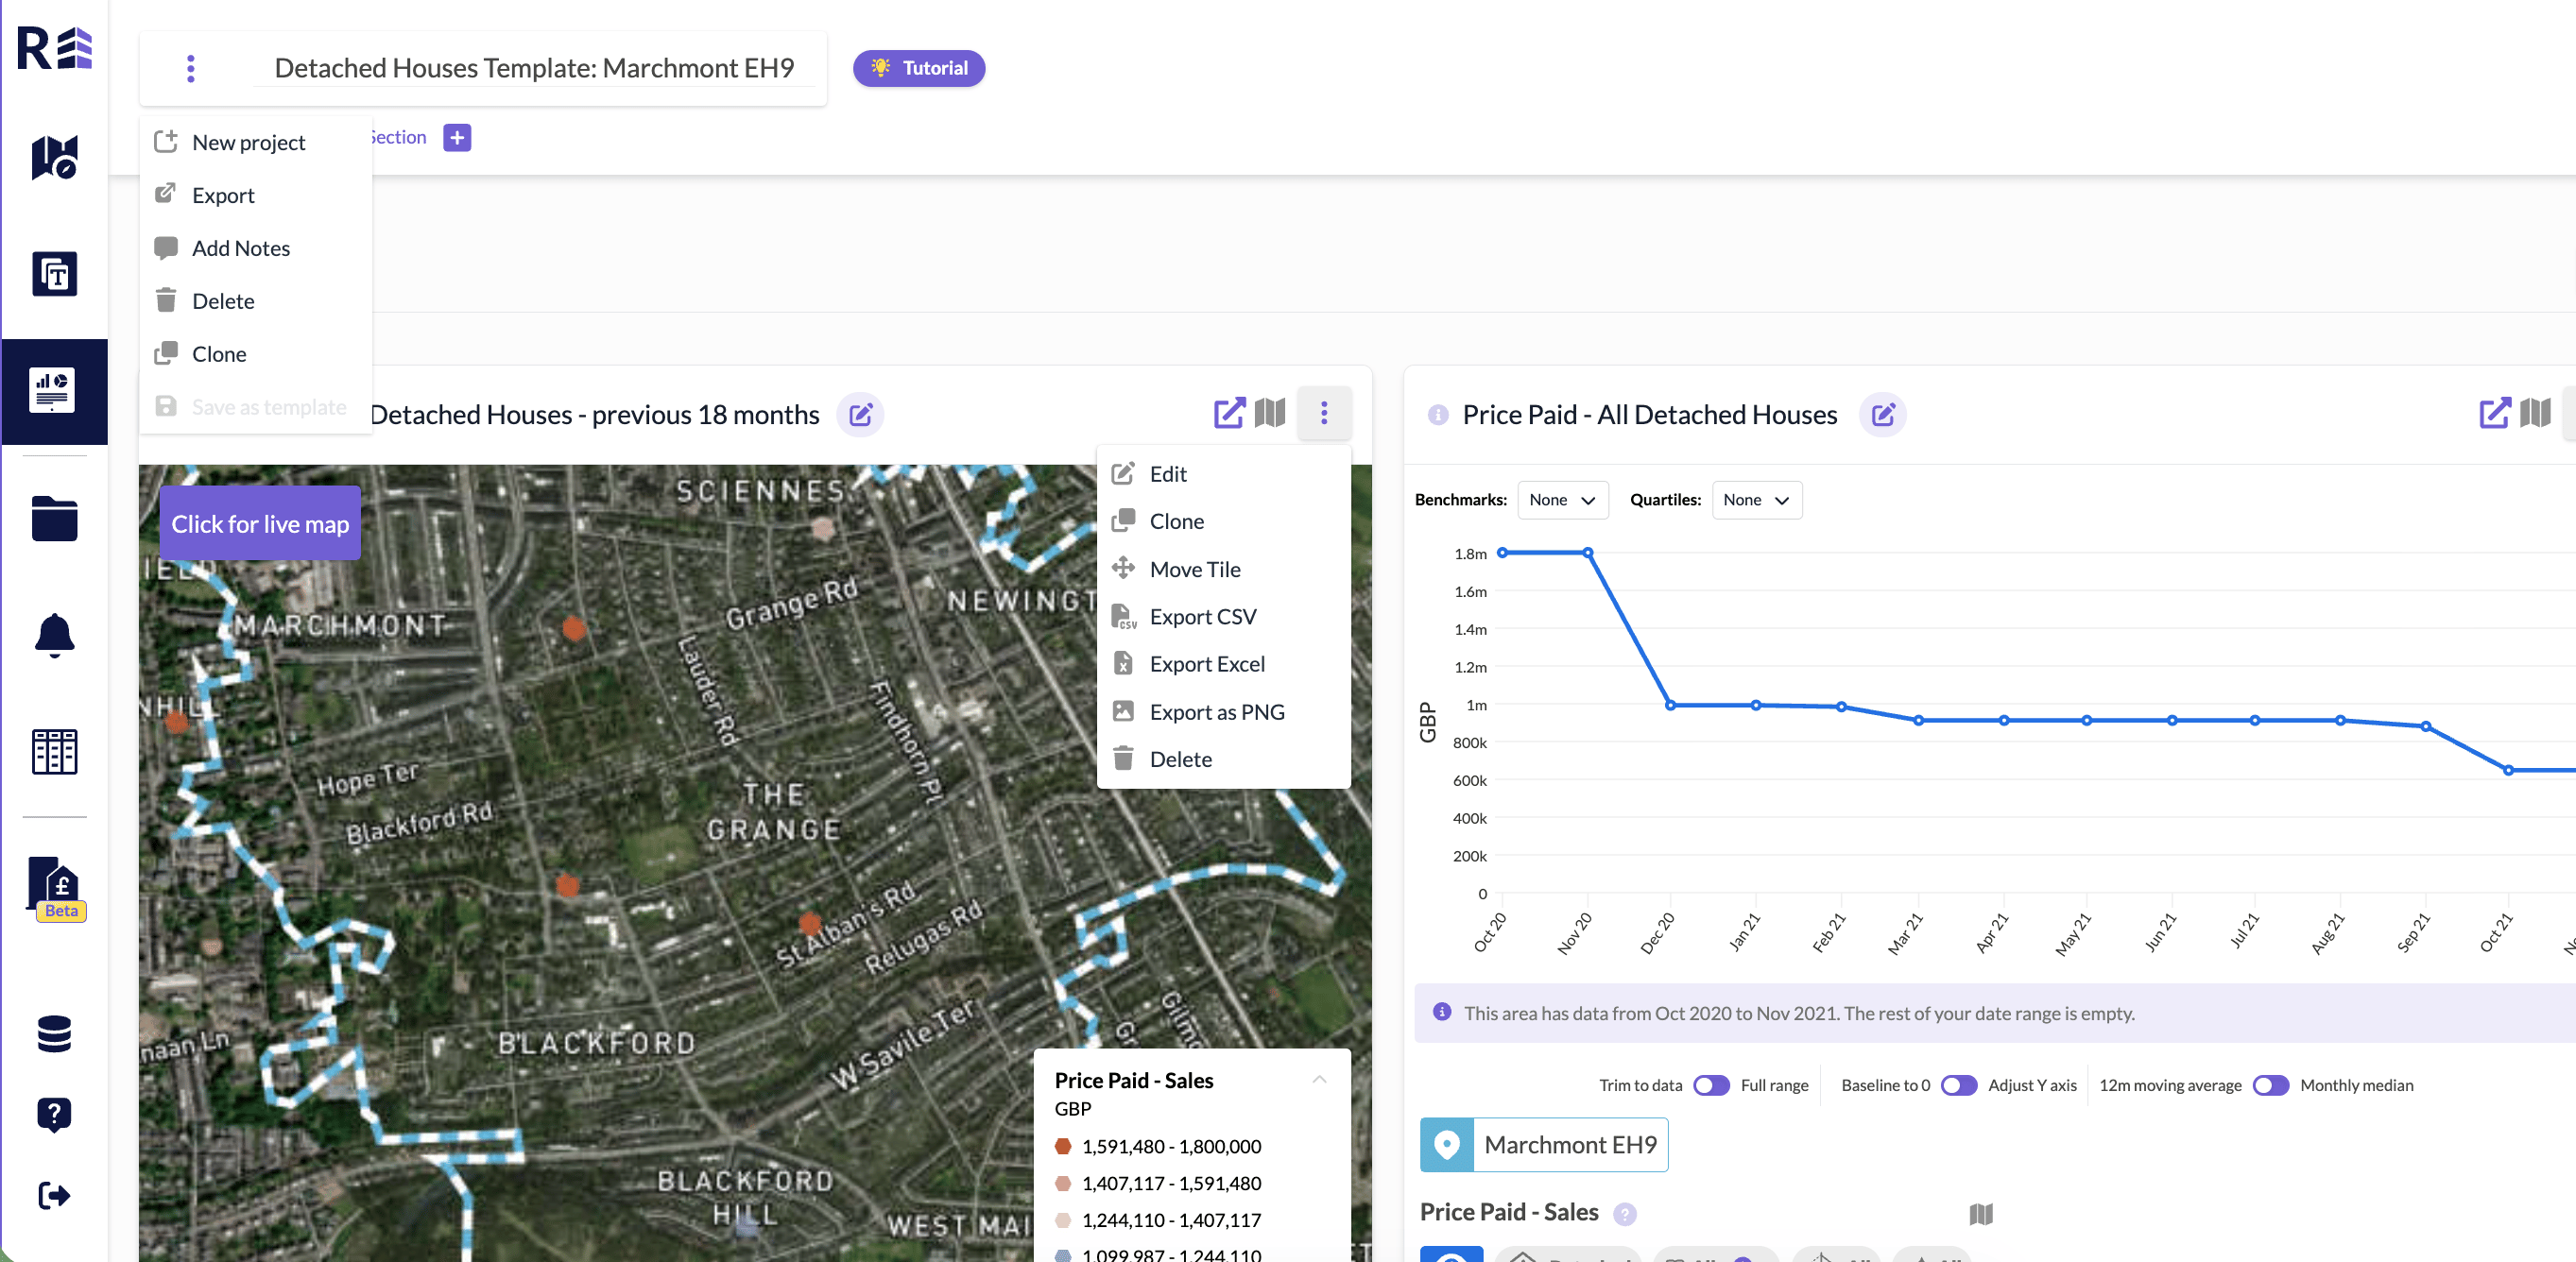
A dashboard with the project menu and a tile menu open.