

Where the data comes from
Demographics data comes from several sources, including the Office for National Statistics (ONS), Census data, Ofsted and the UK Government. Click the ? icon next to any filter to see where that dataset comes from and how often it is updated.See demographics on the map
Heatmaps show a detailed, local view of your location. They use demographic data points to highlight hot and cold areas. Heatmaps respond to the map view, so they update as you zoom in and out. By default, they also show the areas around your location. To show only your saved location, use the surrounding data toggle in the layers panel.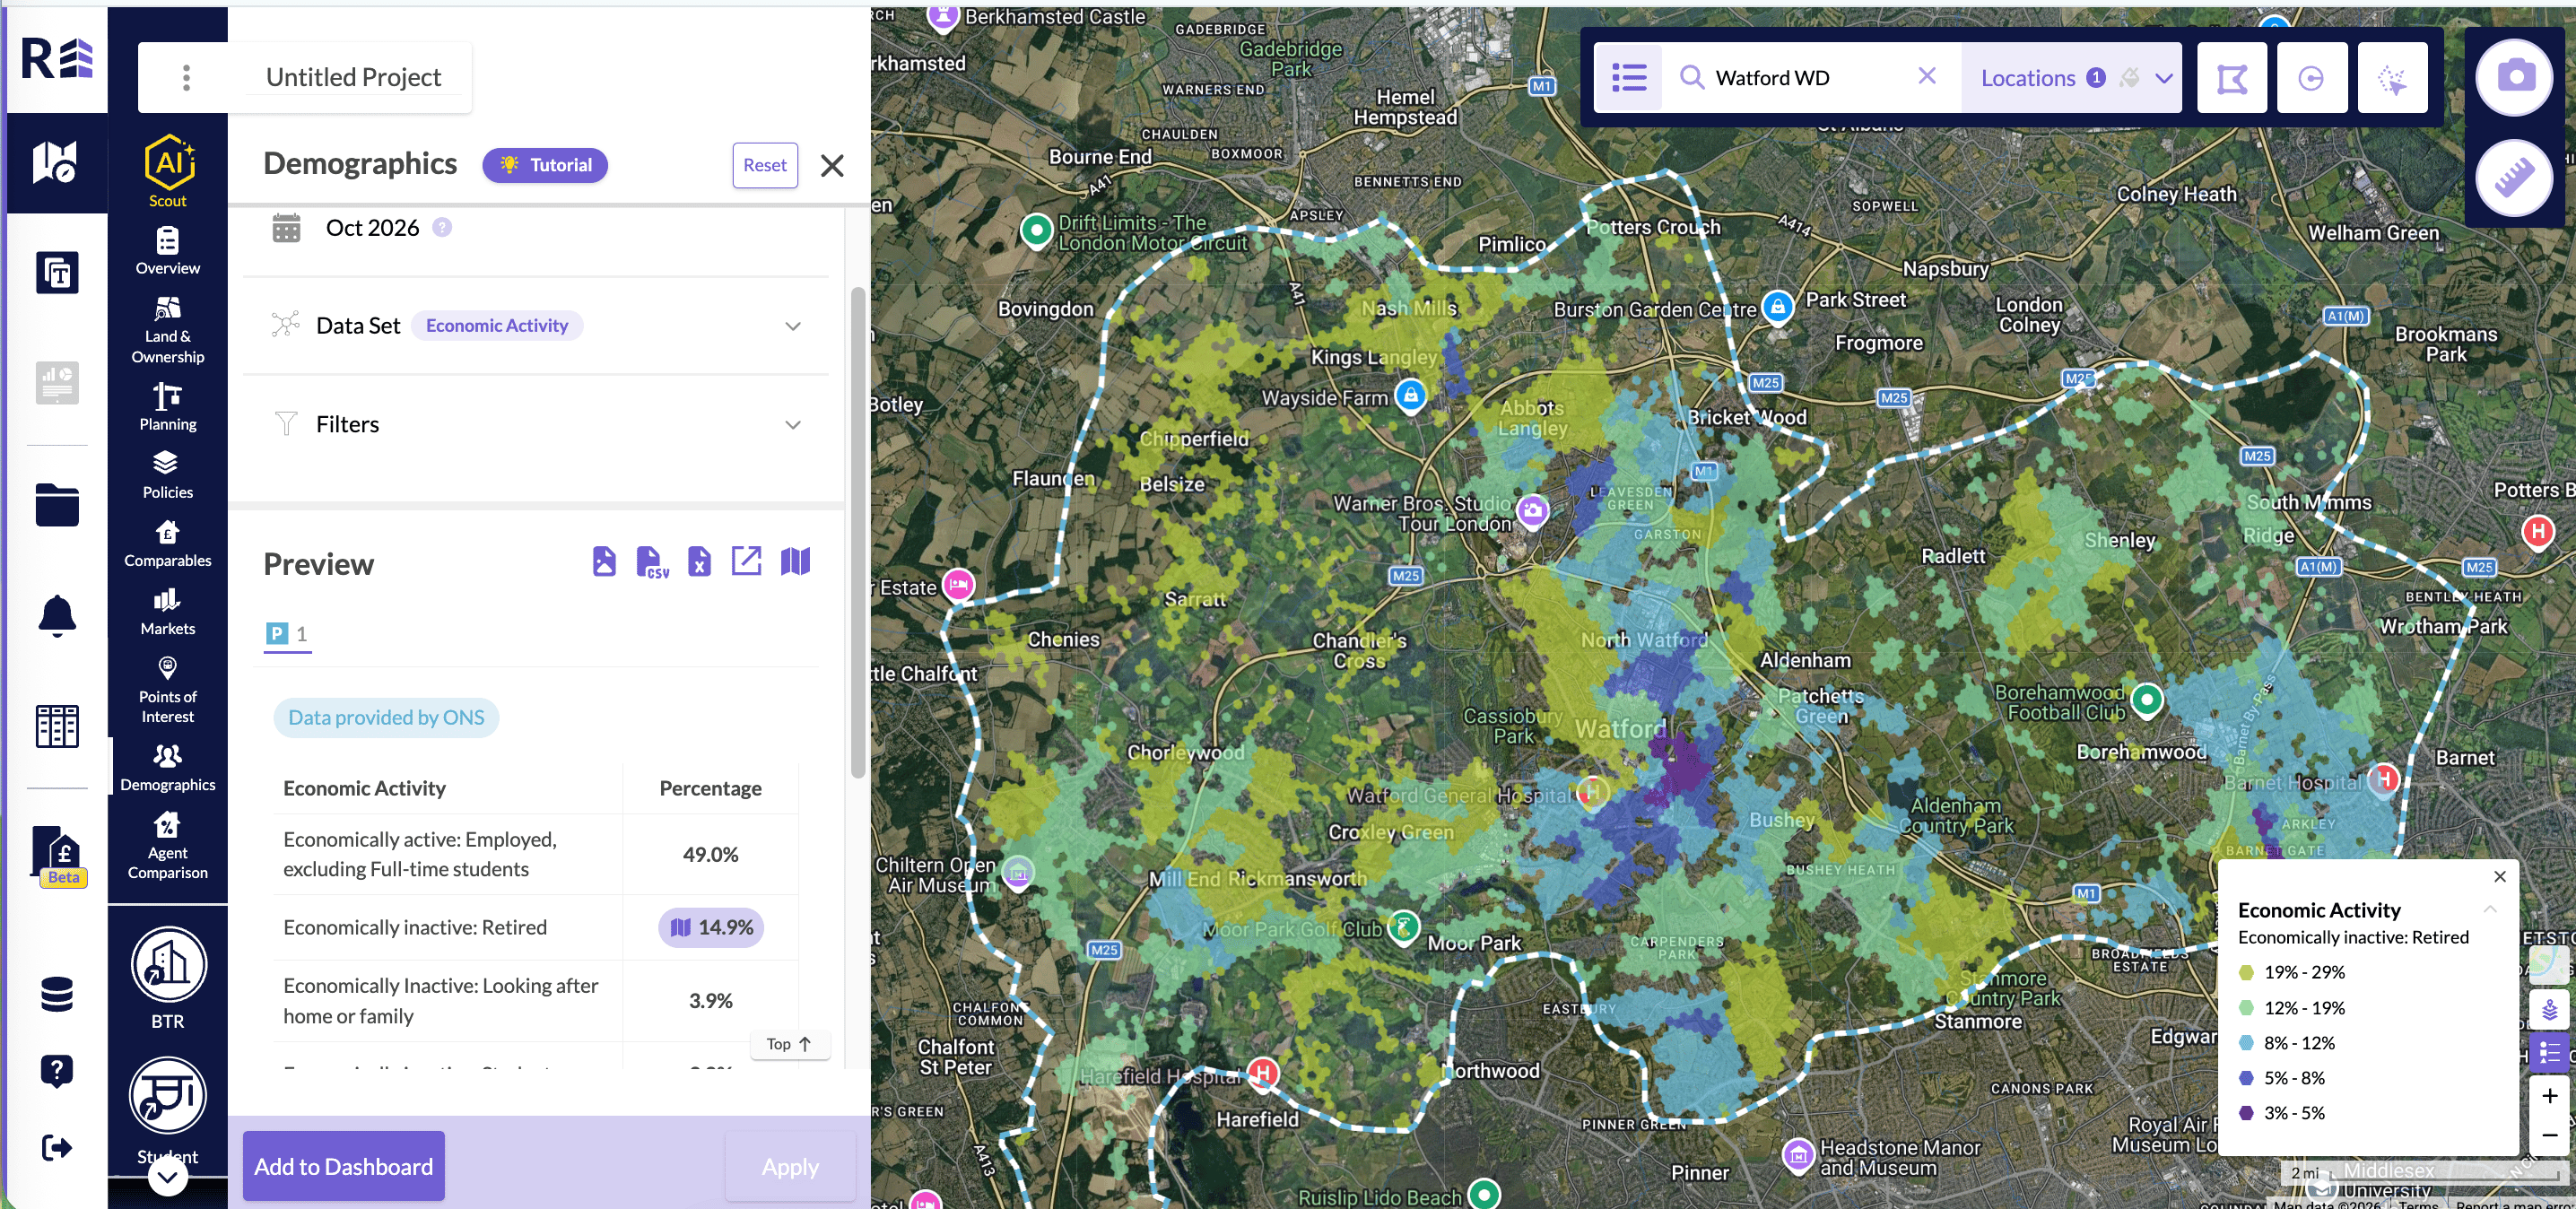
An Economic Activity heatmap for Watford WD, with the legend open on the map.
Compare with a benchmark
Population Education, Homelessness and Crime Statistics charts have a Benchmarks setting. A benchmark compares your location with a wider area. In Benchmarks, choose one of these options:- None: the chart shows counts for your location only.
- National: compares your location with the national figure.
- Regional: compares your location with its region.
Population Education
With a benchmark, each bar shows the share of the population with that qualification. The Y axis reads Population % and runs from 0 to 100. A grey dashed mark on each bar shows the benchmark share. The national benchmark shows as BM: England & Wales. Hover over a bar to see the share and count for your location. The tooltip then shows the share and count for the benchmark.Homelessness
With a benchmark, the figures become households per 1,000 households. The comparison applies to the threatened and assessed figures. The number of households has no benchmark.- In the table, a grey per 1,000 line appears under the threatened and assessed figures.
- In the expanded bar chart, the bars sit side by side instead of stacked. A dashed mark shows the benchmark.
- The Y axis reads Per 1,000 households (total).
Crime Statistics
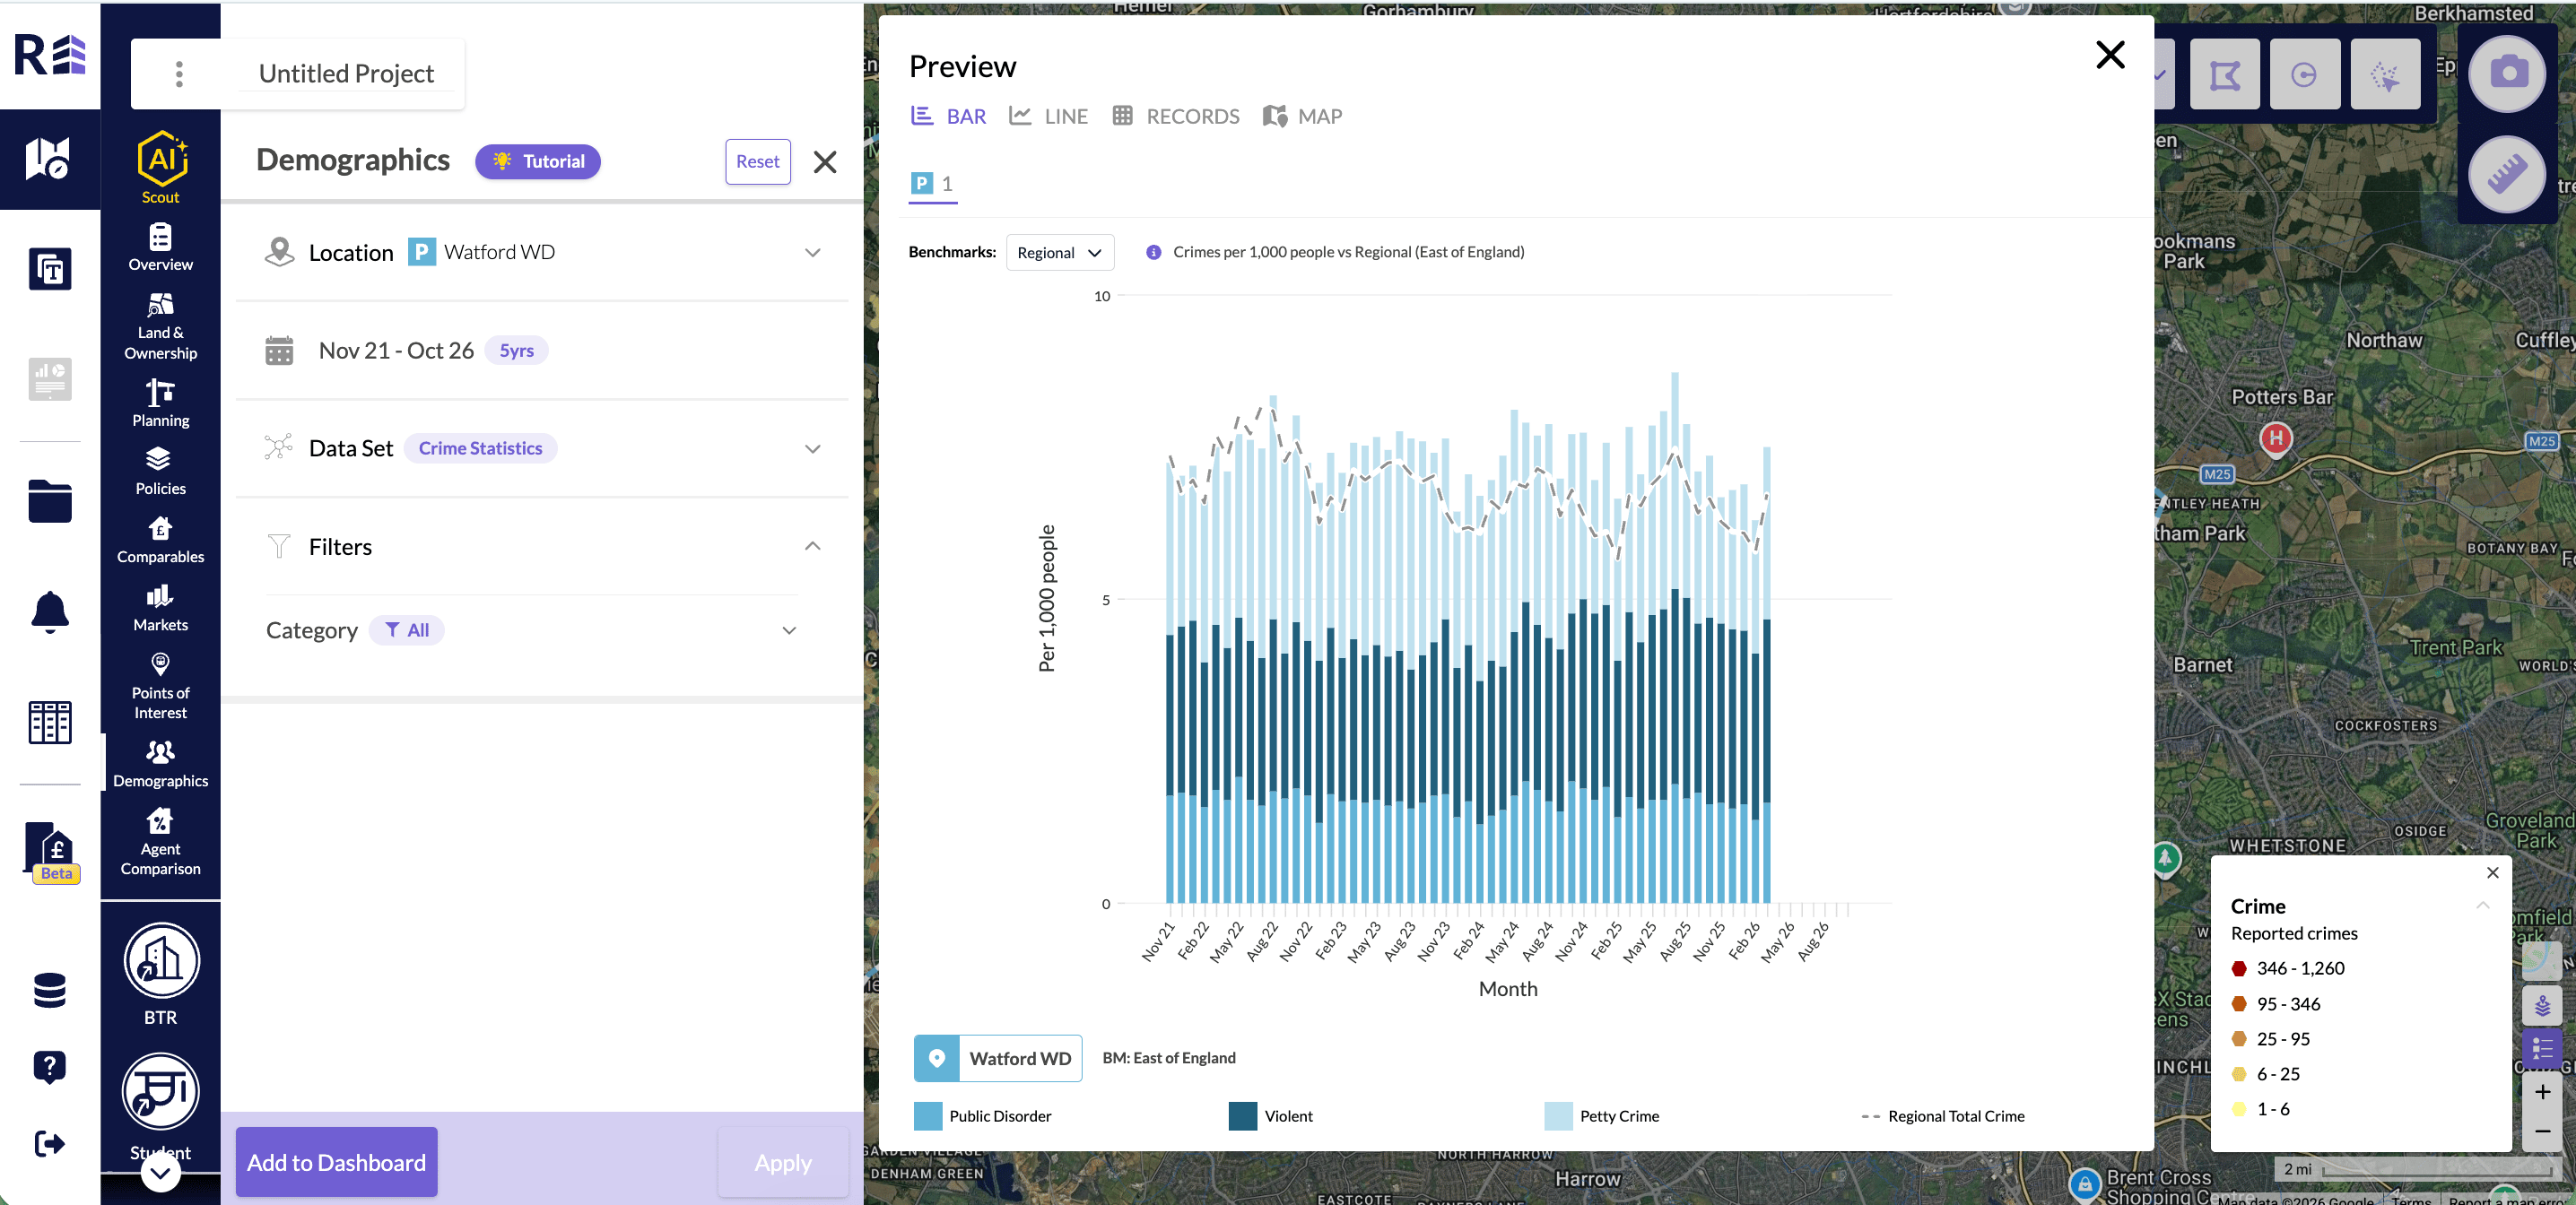
With a benchmark, the figures become crimes per 1,000 people. This works in the line view and the bar view. In the line view:- The Y axis reads Per 1,000 people.
- Each crime type has a dashed benchmark line.
- You can show or hide each benchmark line on its own.
- The bars are grouped by crime type.
- A dashed mark in the same colour as each bar shows the benchmark.
- Hover over a bar to see the rate and the number of crimes for your location and for the benchmark.
Choose an age view
Population by Age and Income by Age charts have an Age view setting. You find it on the chart in Explore, in the slice preview and on the dashboard tile.Population by Age
In Age view, choose one of these options:- Single year: one bar for each year of age.
- Banded (5 years): one bar for each 5-year age band.
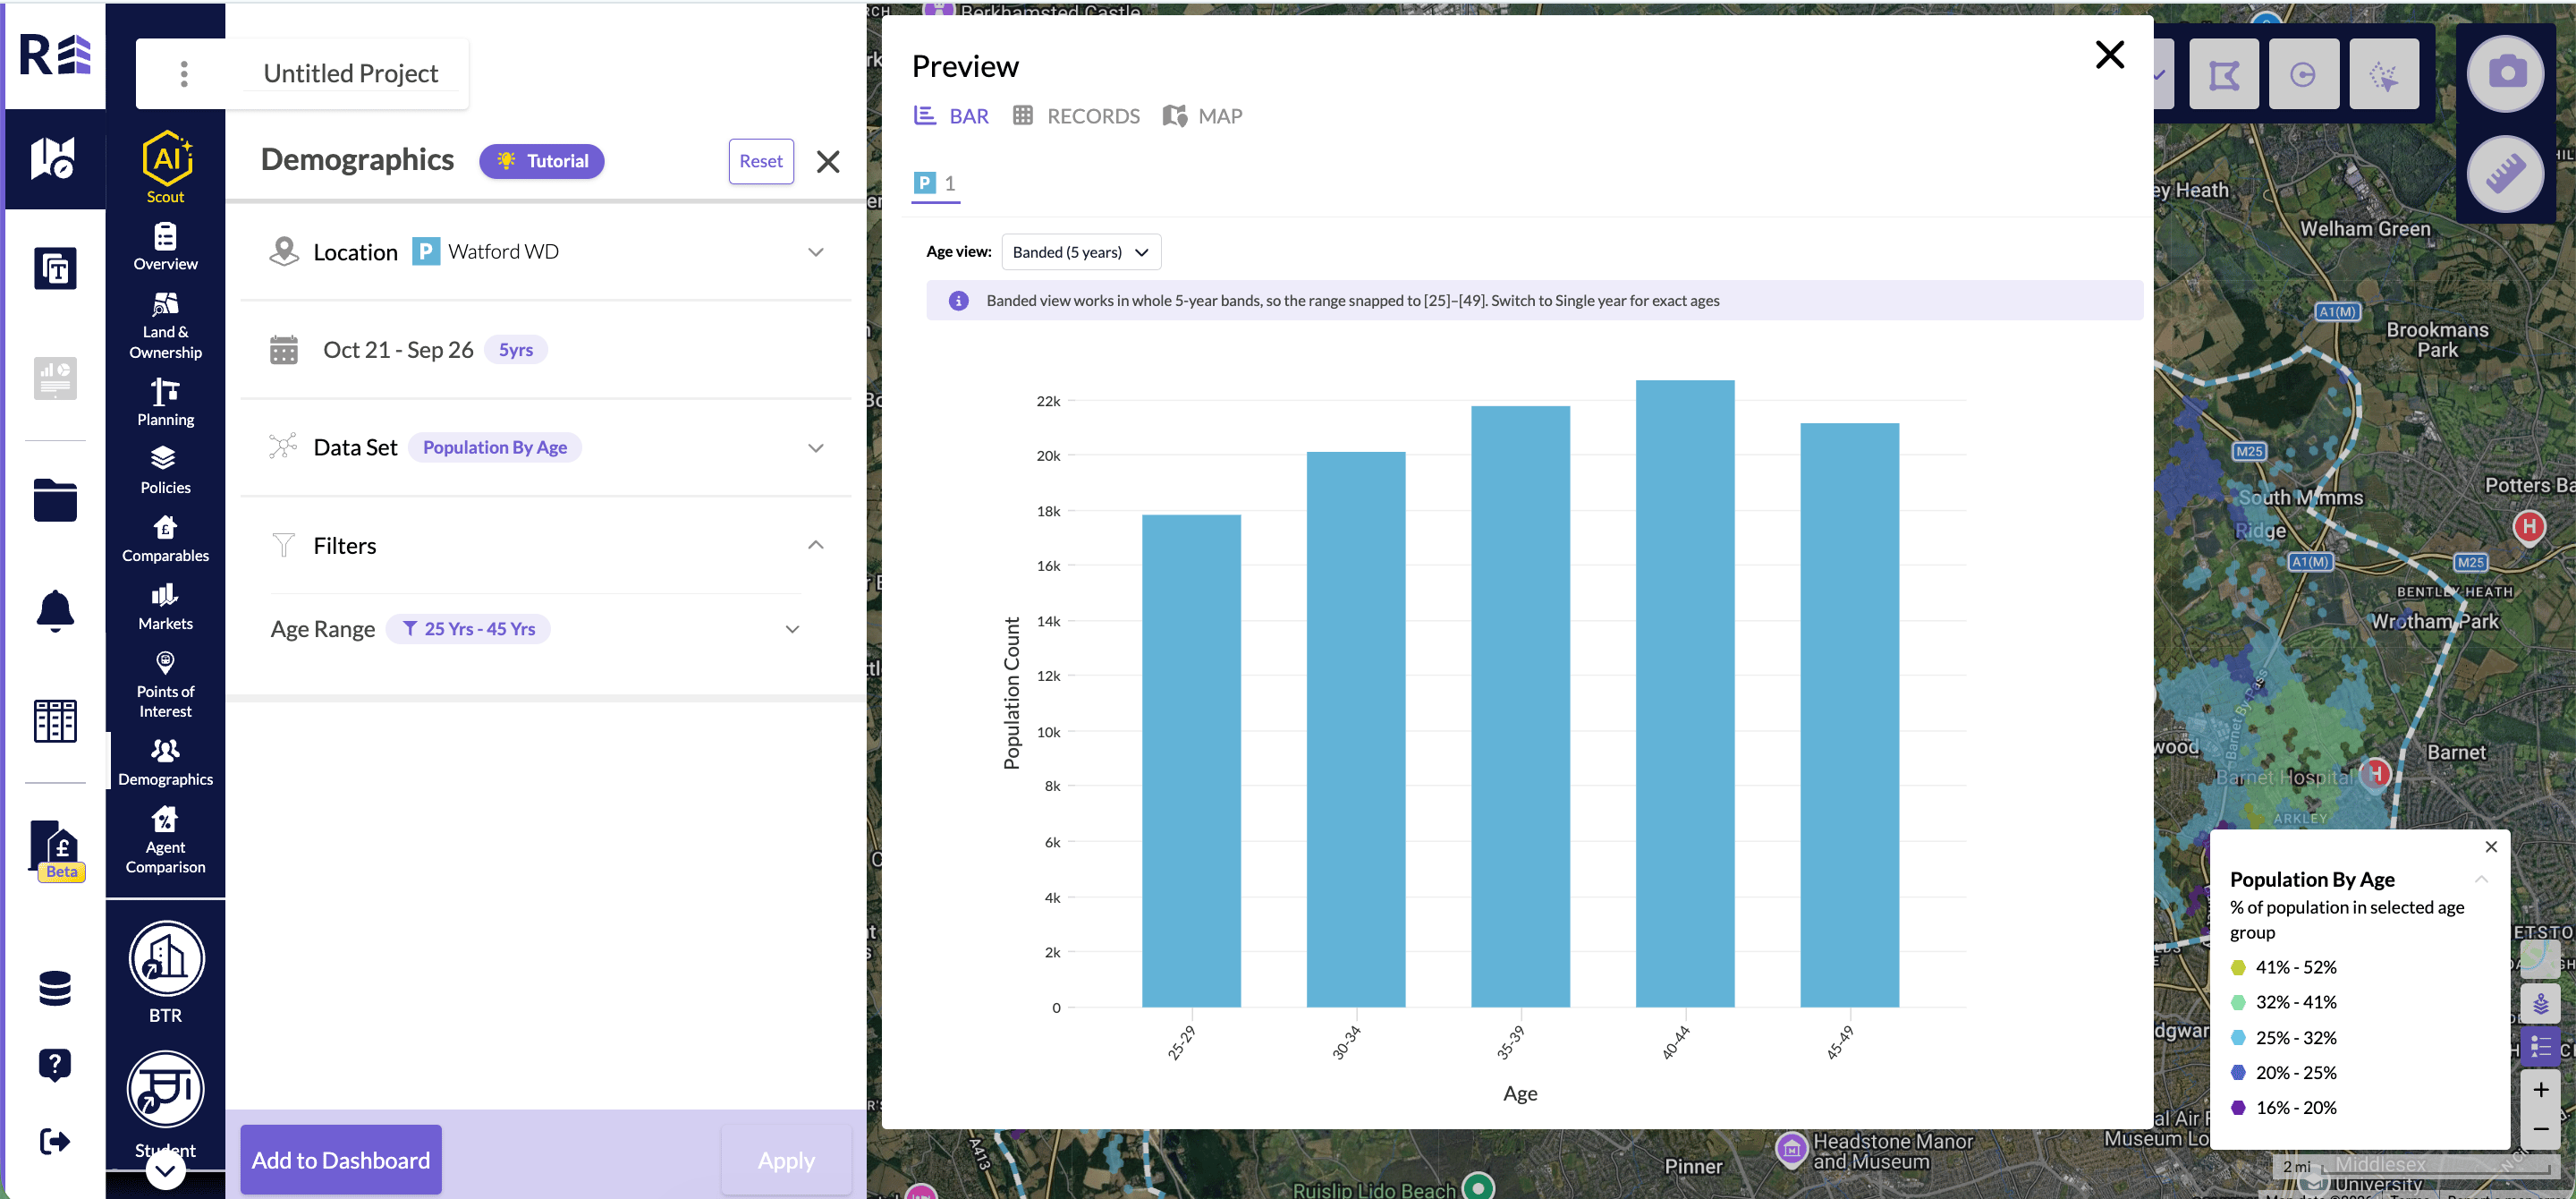
Population by Age in Banded (5 years). An age range of 25 to 45 snaps to 25 to 49.
Income by Age
In Age view, choose one of these options:- None: a line of monthly income over time.
- Banded (5 years): one bar for each 5-year age band, for the latest month.
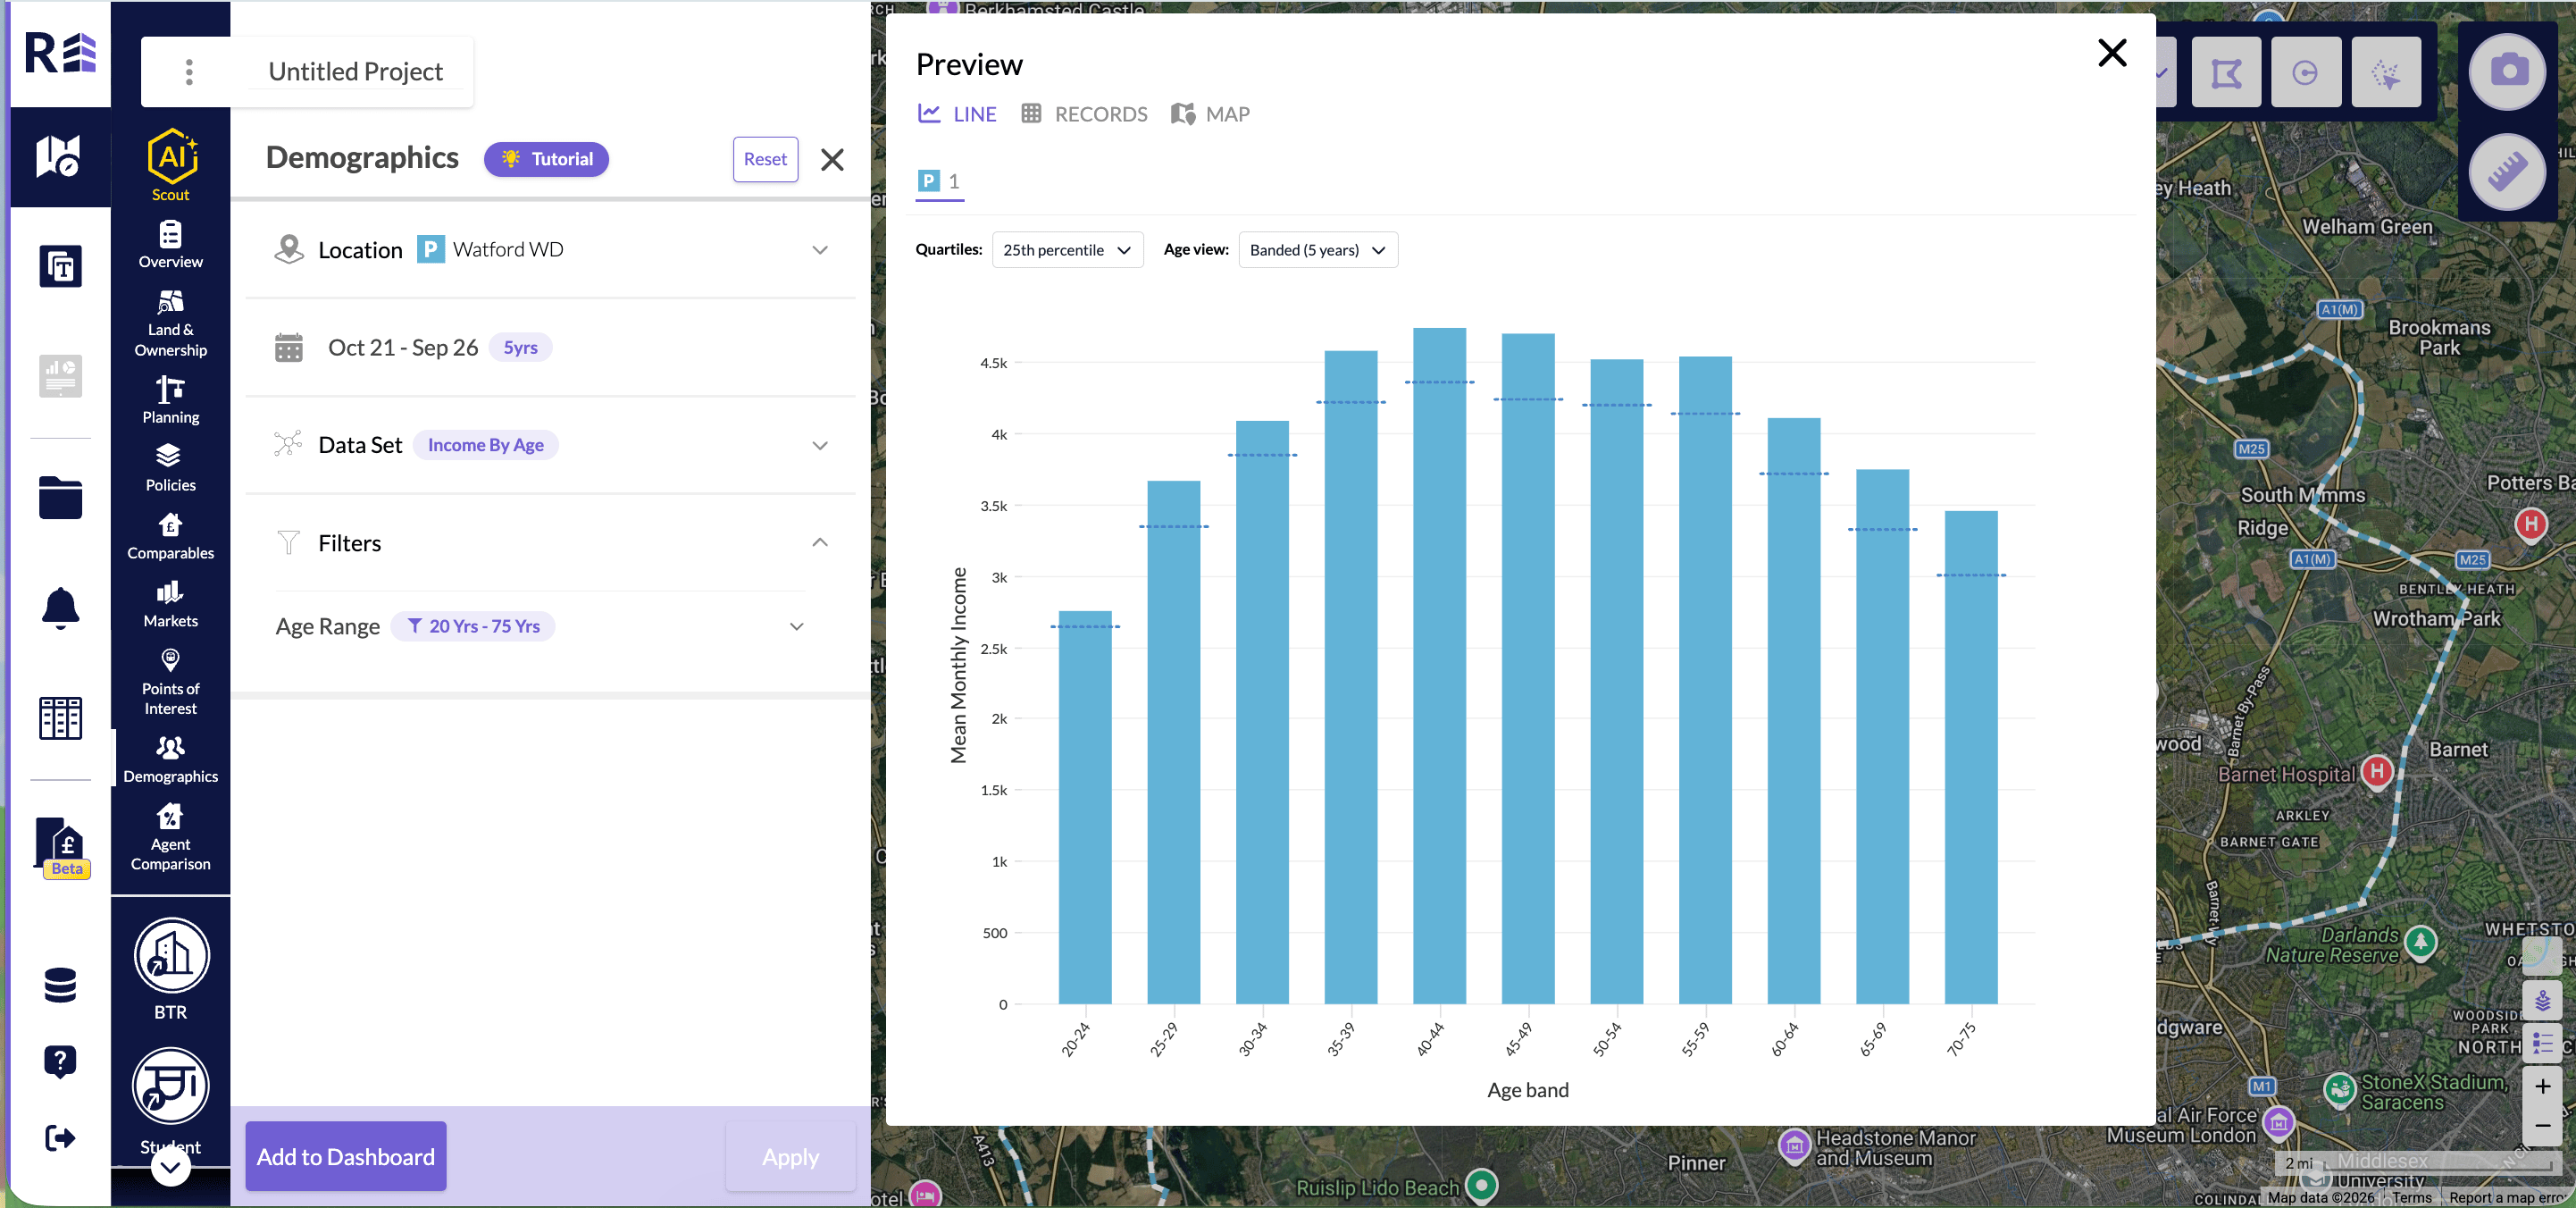
Income by Age in Banded (5 years), with Quartiles set to 25th percentile.
Export to CSV or Excel
CSV and Excel exports follow the Age view you have chosen. This applies when you export from the slice preview in Explore, from the dashboard tile menu or from the whole dashboard. For Population by Age:- Single year exports single years of age.
- Banded (5 years) exports 5-year age bands, with the same range as the chart.
- None exports one row for each month. The columns are Date, Value, P25 Value, P75 Value, P90 Value and Population.
- Banded (5 years) exports one row for each month and age band. Each row includes the 25th, 75th and 90th percentiles.
income-by-age_Westminster_2026-10-15.csv. For a custom area, the name leaves out the Custom: prefix. Files inside a dashboard export keep their usual names.
Export a benchmark to CSV or Excel
Benchmark name
Every row starts with the Location, Dataset and Benchmark columns. The Benchmark column names the area you compare with:- National – England & Wales for Population Education and Crime Statistics.
- National – England for Homelessness.
- Regional – followed by the name of your region, for a regional benchmark.
Columns in each export
Population Education has one row for each qualification. The qualifications use the same labels as the chart, such as GCSE <D and Degree. The columns are:- Qualification
- Count of population with level
- Total population
- Area % of population
- Benchmark count
- Benchmark total population
- Benchmark % of population
- Month
- Num Households
- Num Households Threatened and Num Households Assessed
- Threatened per 1,000 households and Assessed per 1,000 households
- Benchmark threatened per 1,000 households and Benchmark assessed per 1,000 households
- Month
- Category
- Count
- Crimes per 1,000 people
- Benchmark count
- Benchmark crimes per 1,000 people