Where the data comes from
Click the ? icon next to any policy filter to see where that dataset comes from and how often it is updated.Keep the map readable
Select one or two policy filters at a time. With too many filters, the map fills with colour and becomes hard to read. For example, search for brownfield and Greenbelt sites, then run a separate search for flood risk areas, so that one does not hide the other.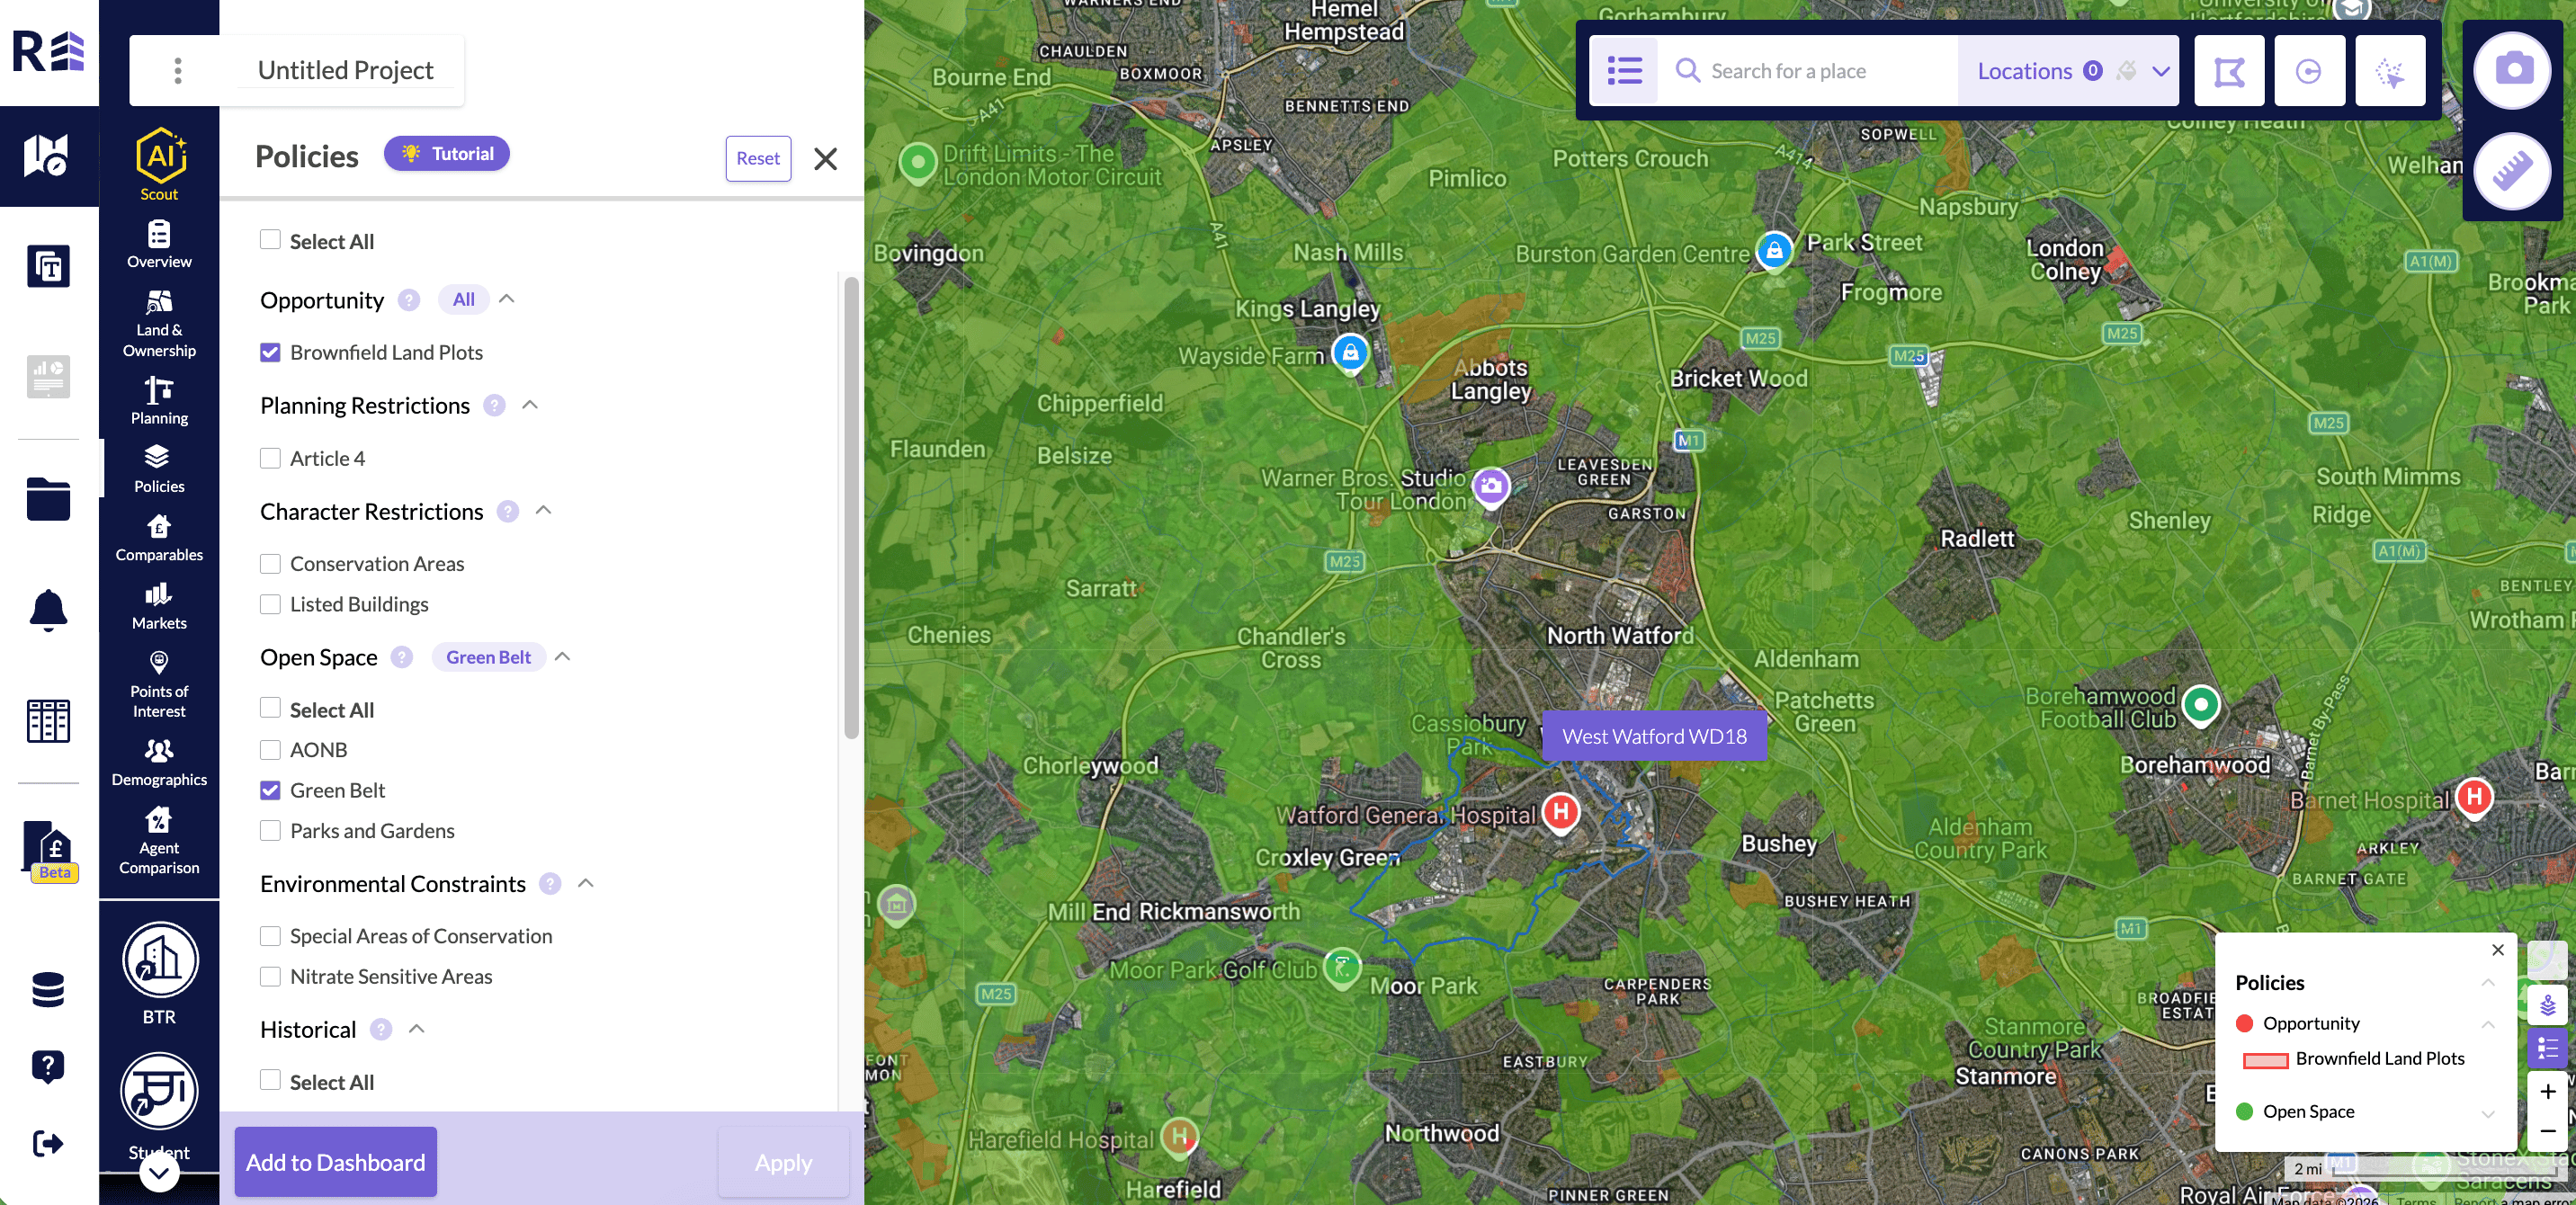
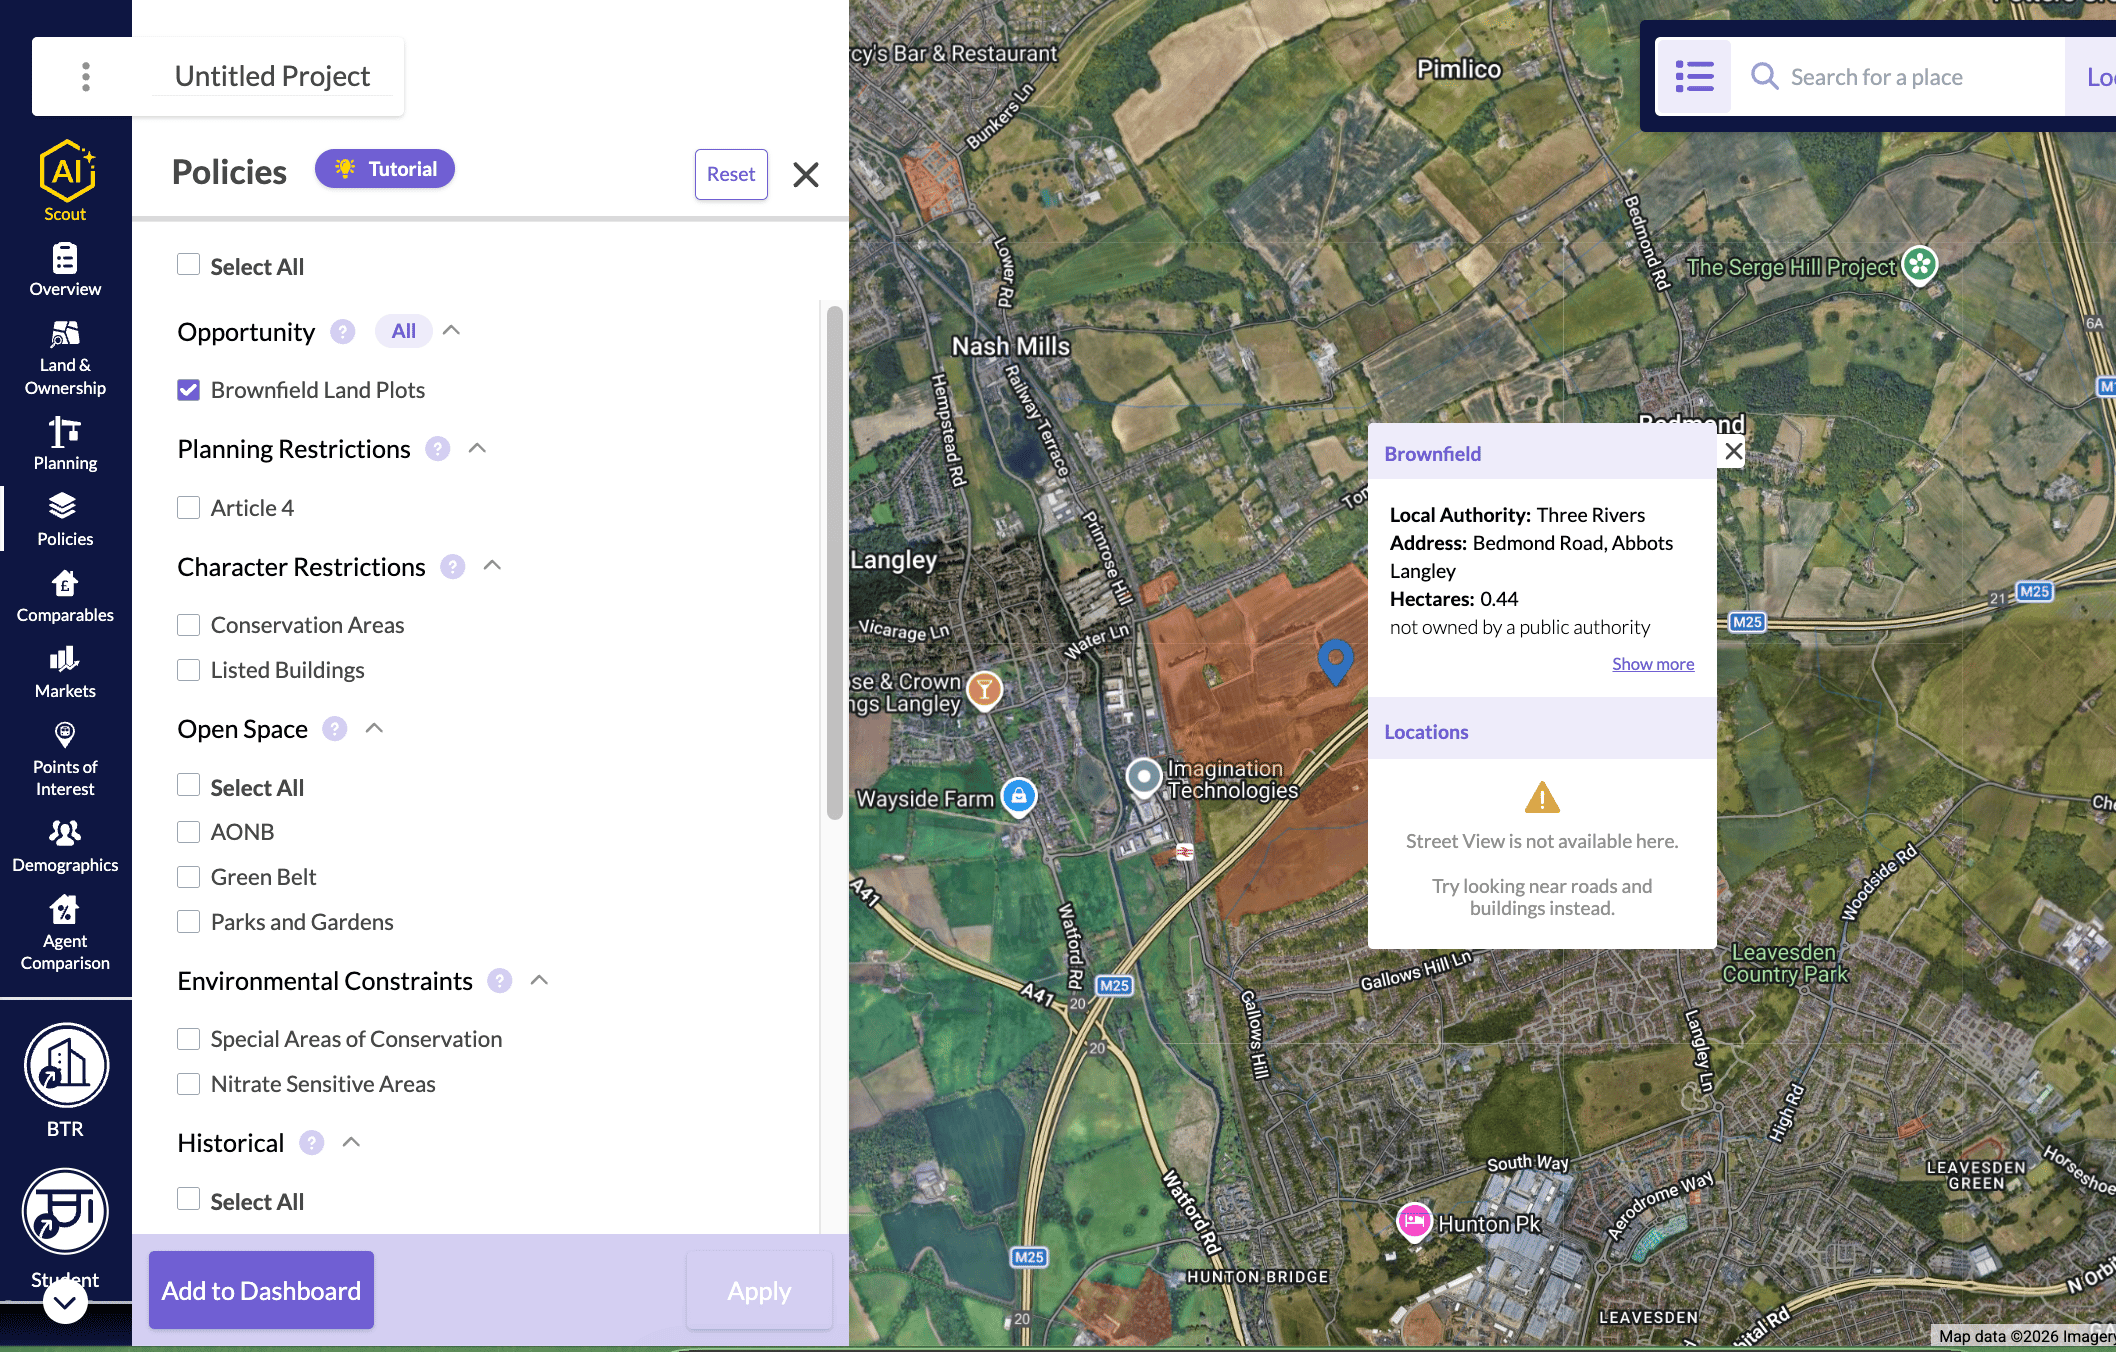
Click on the coloured polygons to view the policy details
Click on the coloured polygons to view the policy details
- Search for Brownfield sites in the policy section.
- Click a coloured area on the map.