Locations
Add a location
Every search starts in the purple search box in the centre or top right of your screen. You can add a location in three ways.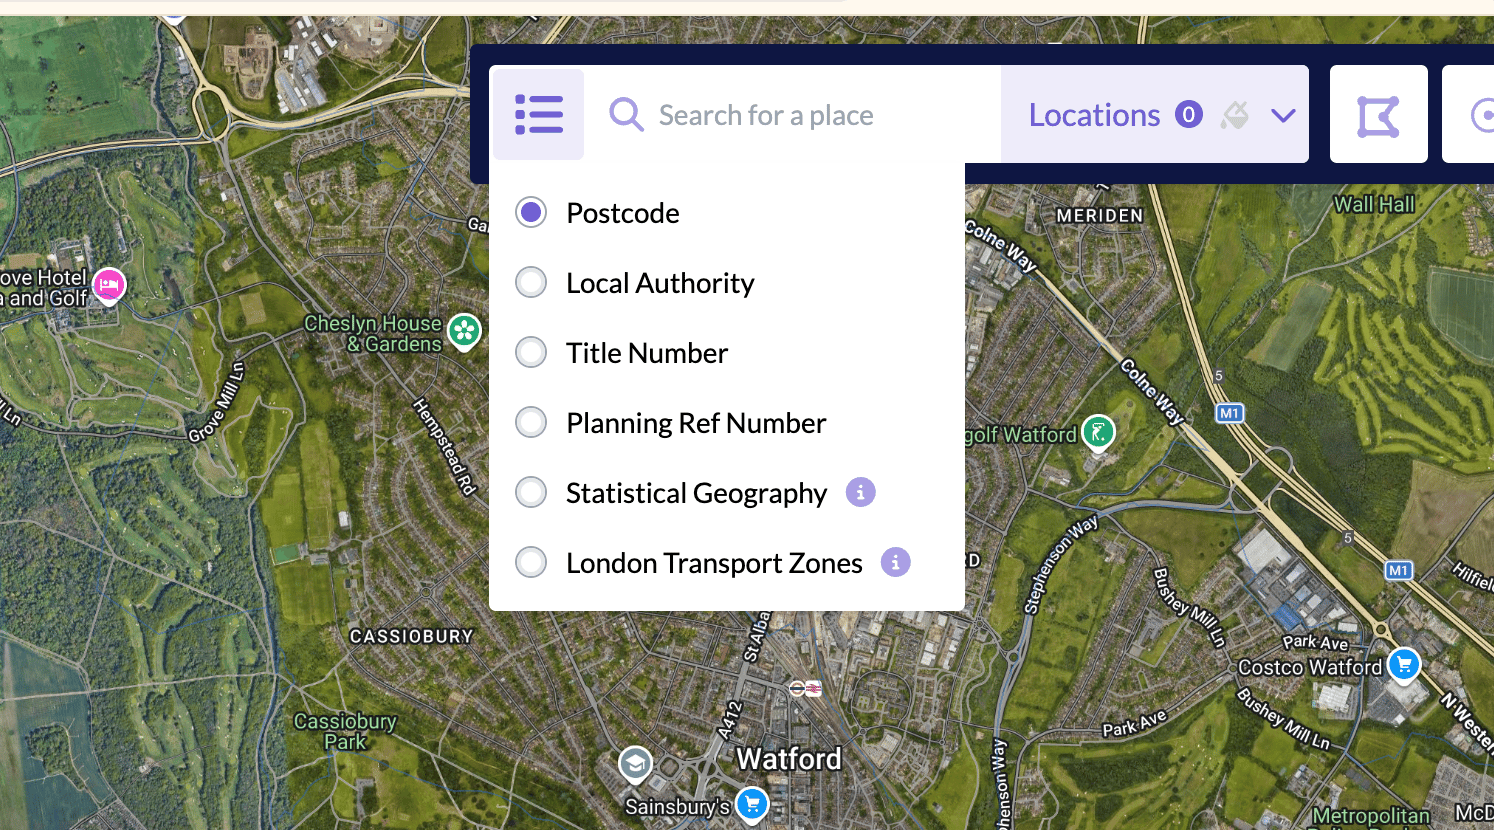
Search for a place, with the search-by list open.
- Postcode: Enter a postcode district (NW3), a postcode sector (NW3 2) or a full postcode (NW3 2PY). A full postcode drops a pin at that location. You can then use the custom polygon or radius to widen your search.
- Local Authority: Search by local council or district. In London, this is the borough. Use this for a wider search.
- Title Number: Enter a title number from HM Land Registry to go straight to that plot of land. This also turns on land ownership, so you can see the details and who owns the site.
- Planning Ref Number: Enter the unique reference of a planning application to open it. The format is
2023/1116/P.
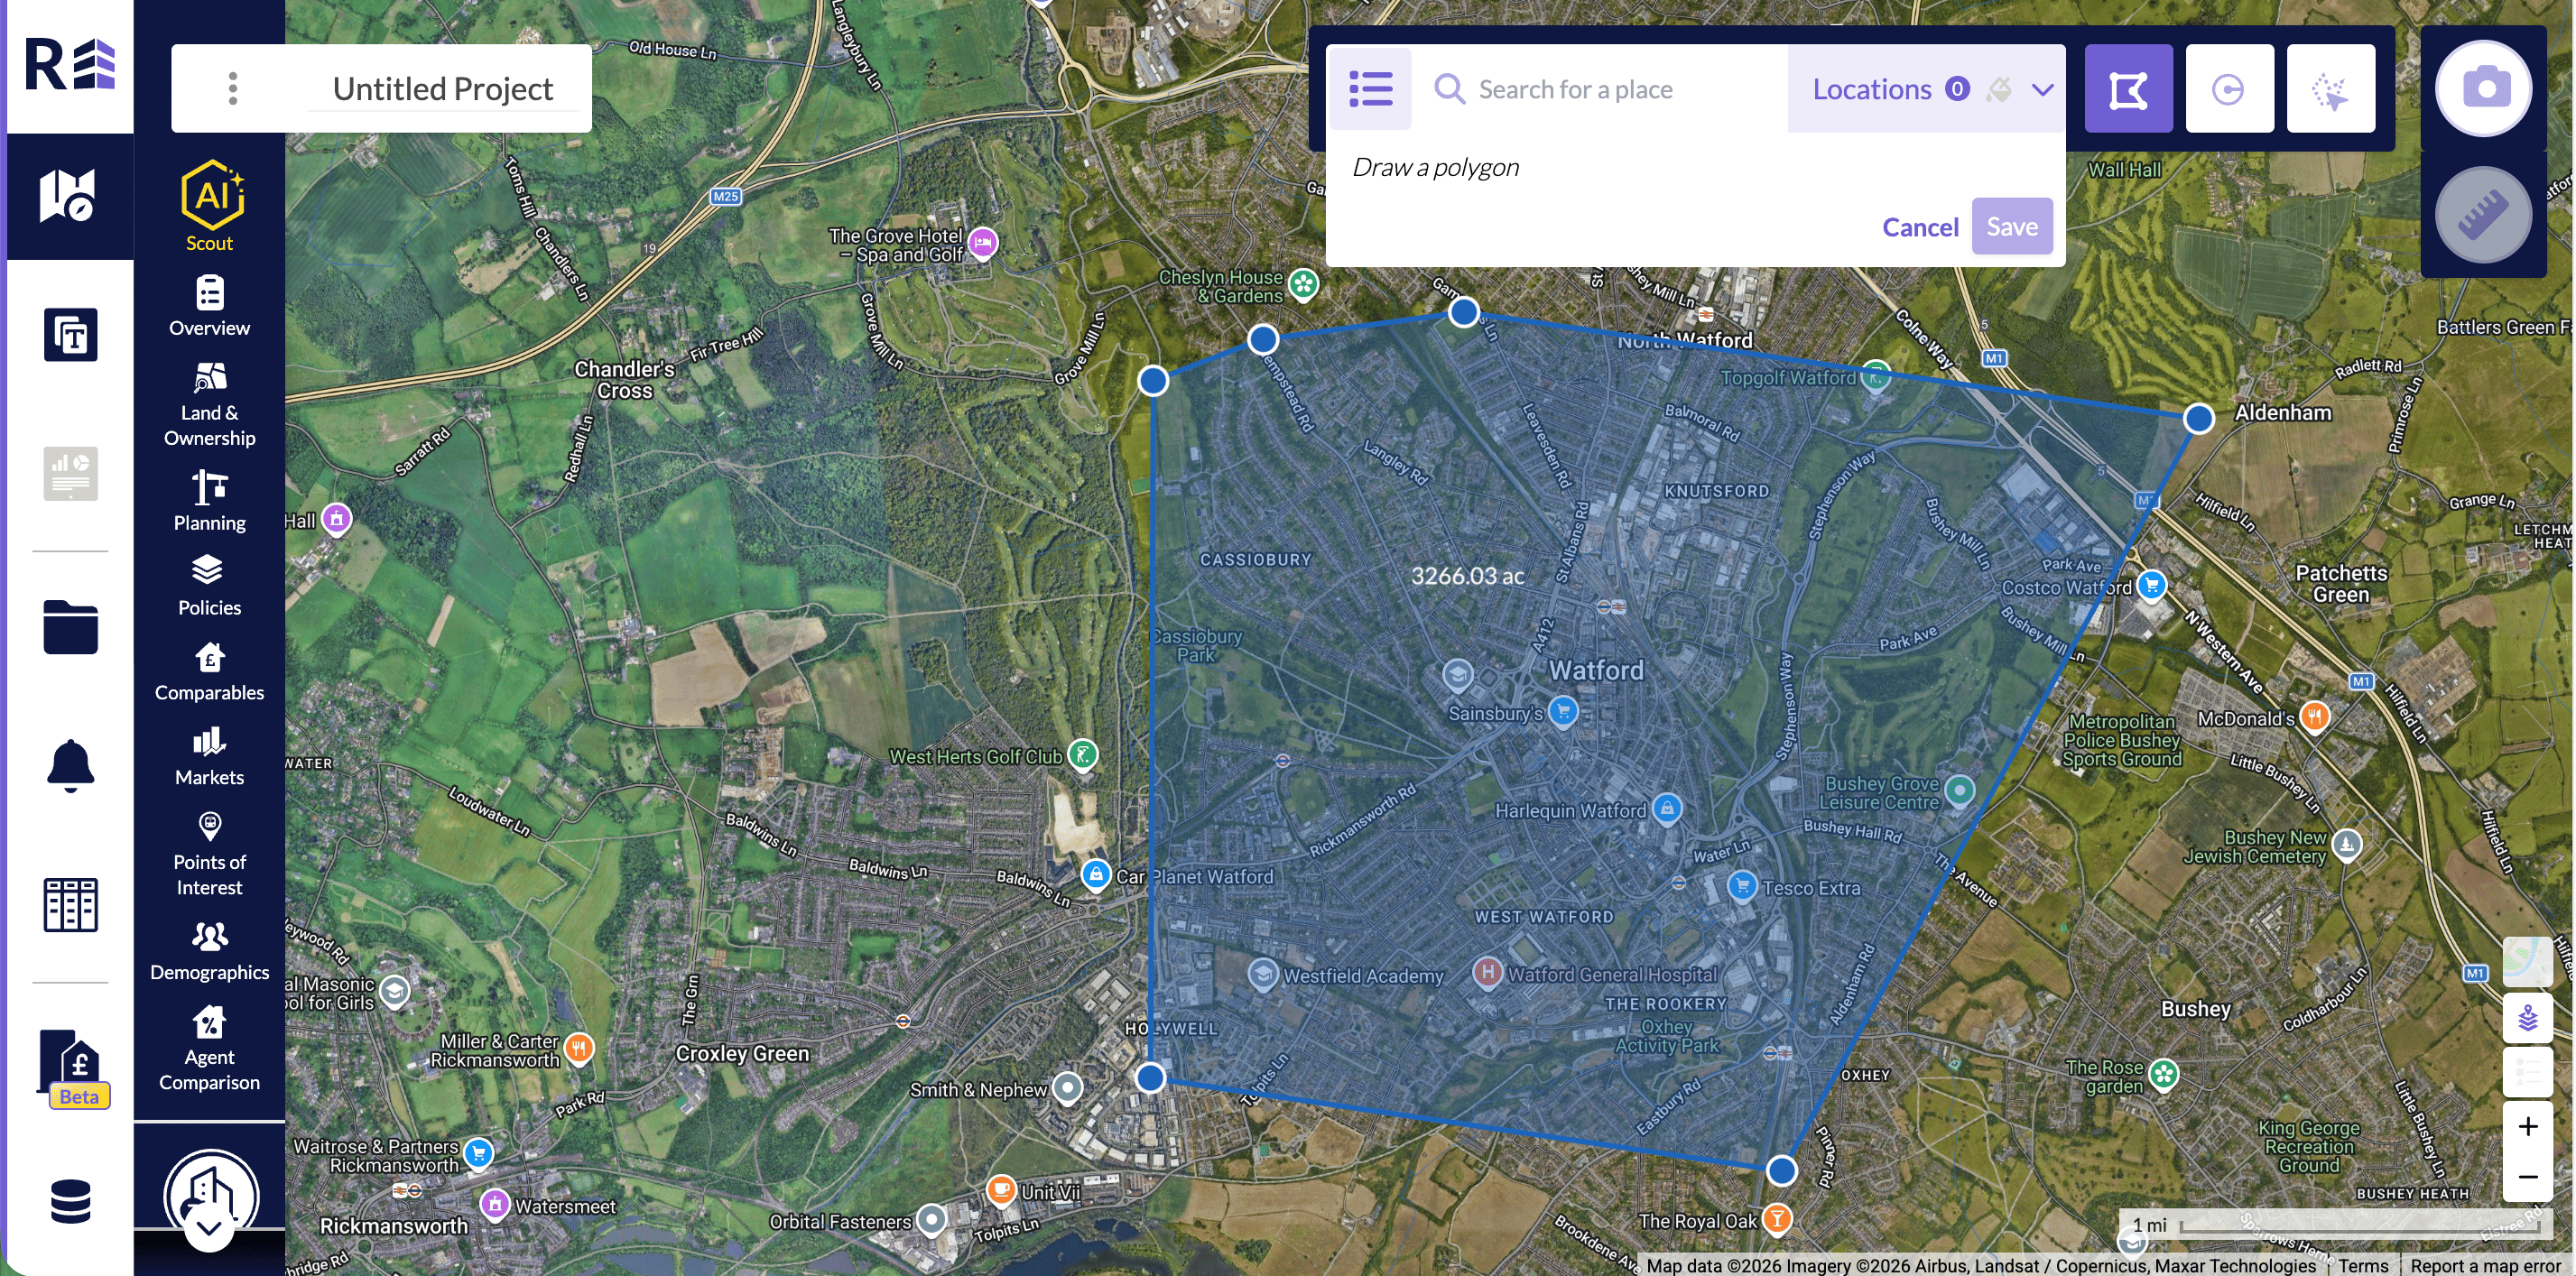
A custom polygon drawn on the map.
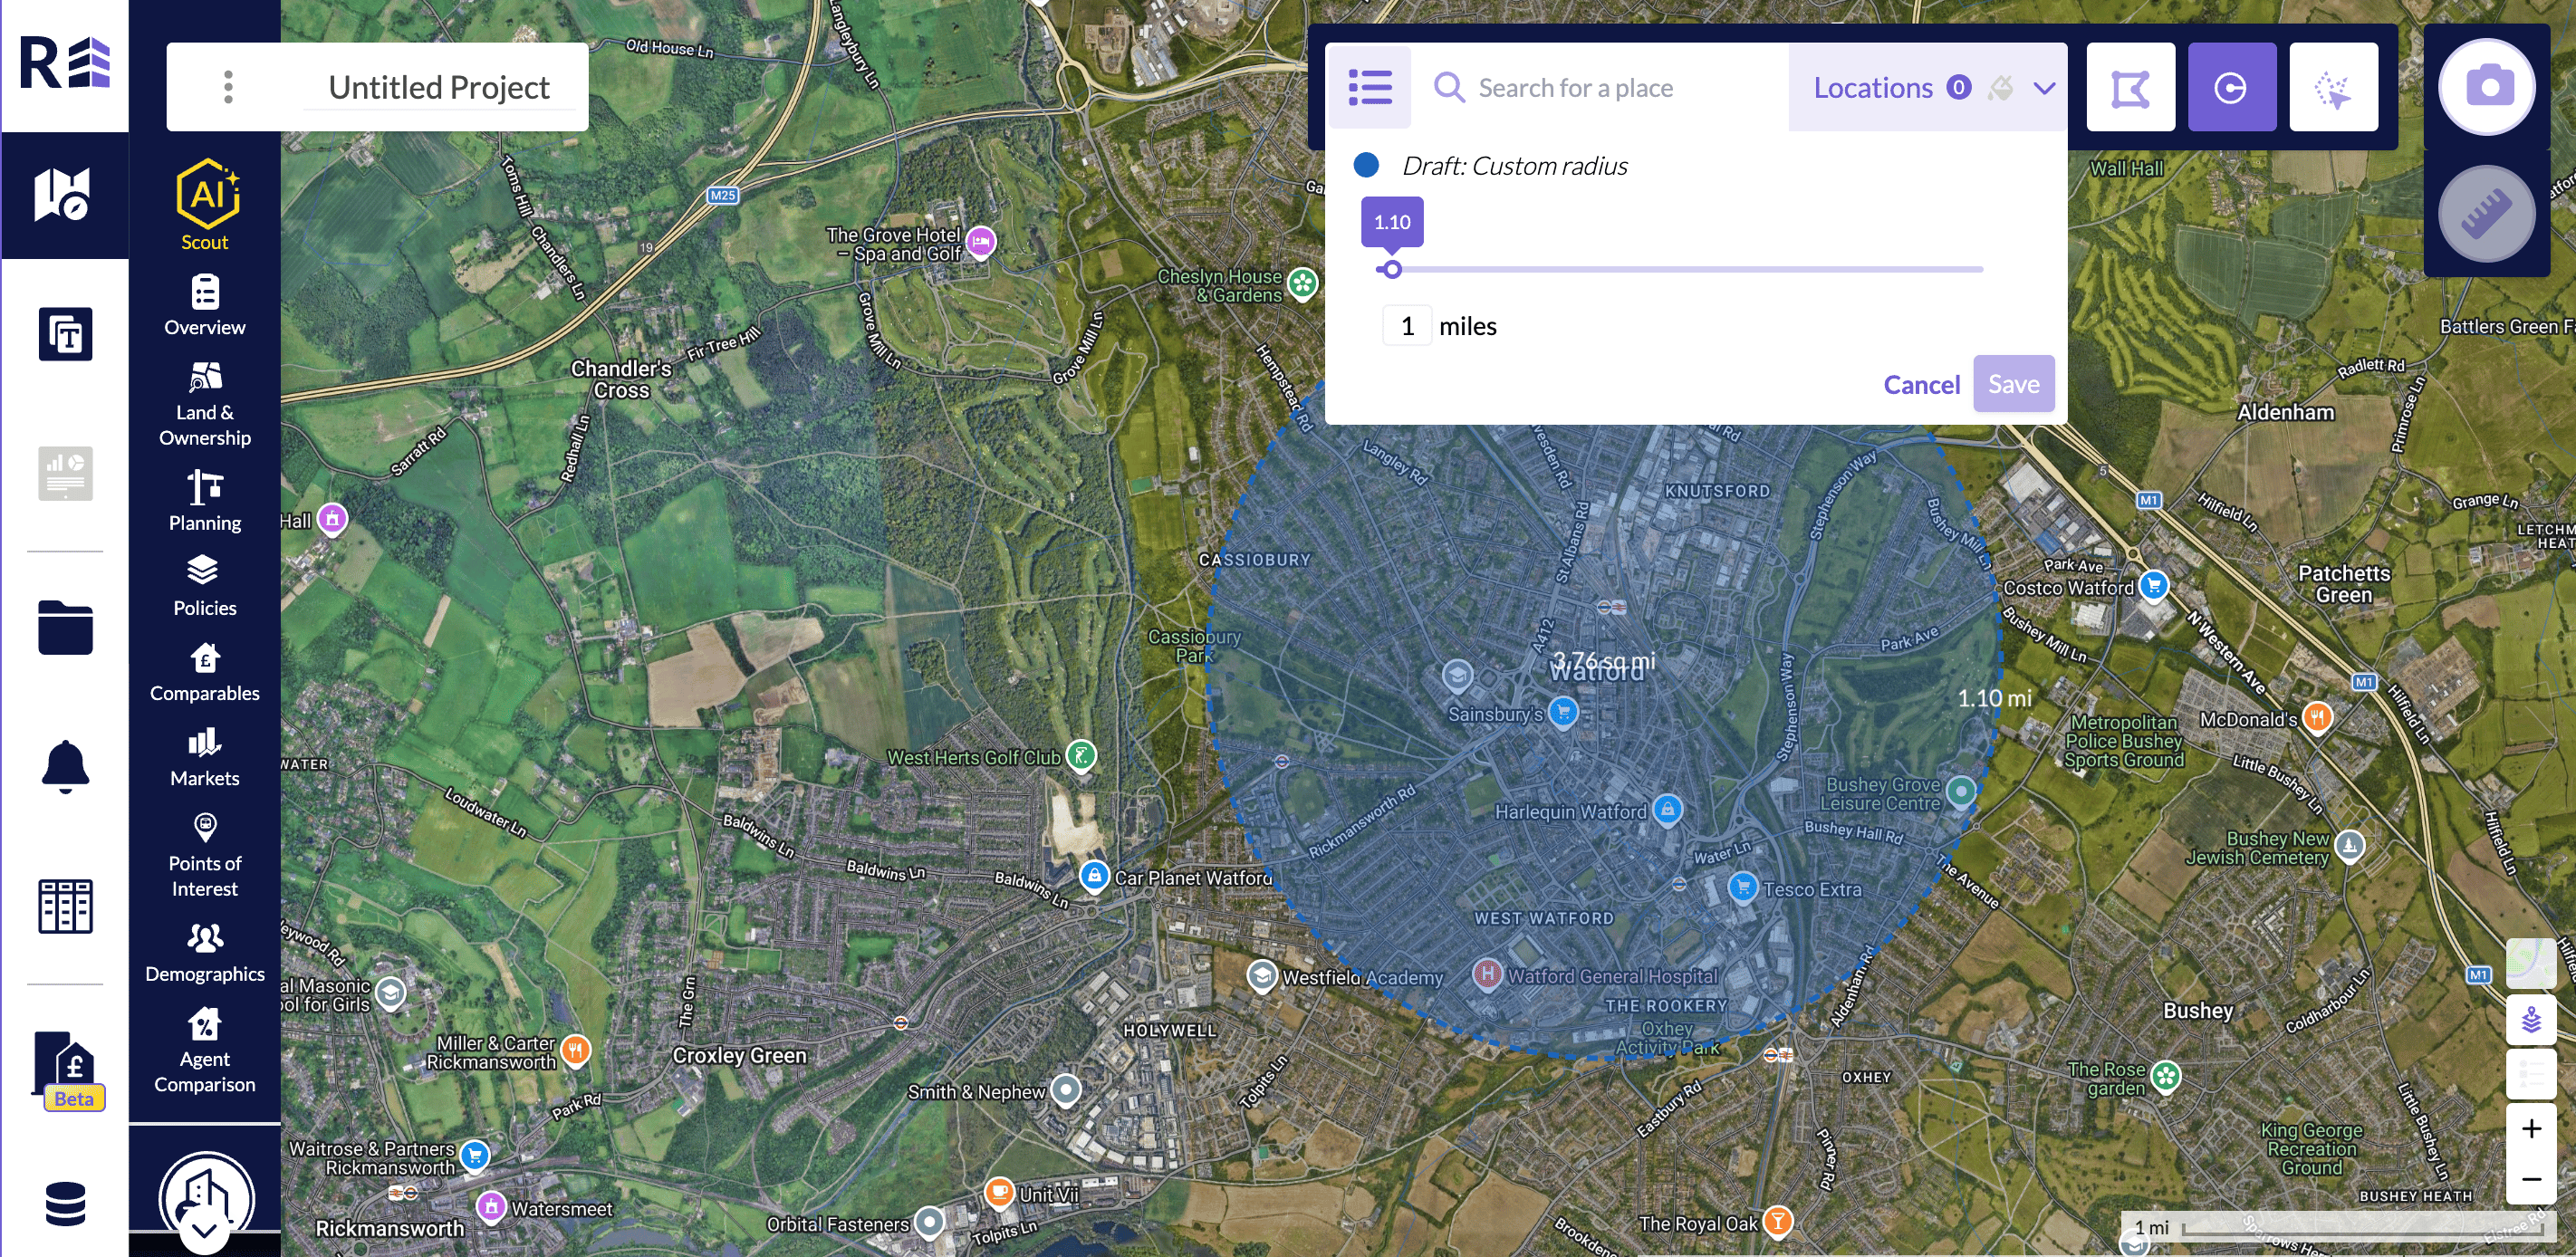
A custom radius with the distance controls.
Edit a location
You can edit a location whether or not it is saved to your project.- Open Locations, then under Project Locations click the edit icon.
- Rename the location, or change the distance with the slider or the miles field.
- Click Save. Click Cancel to leave it unchanged.
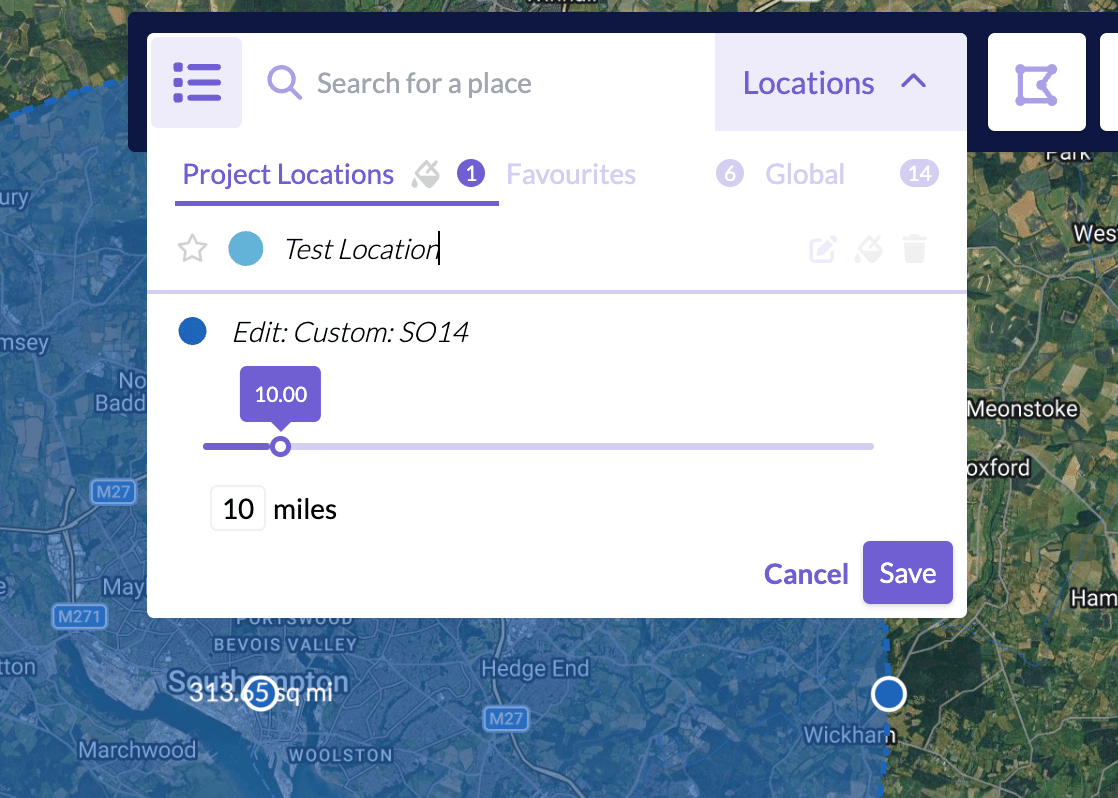
Editing a project location.
Save a favourite location
A saved area is added to your project locations. Click the star icon to the left of the location. The tooltip reads Copy location to favourites. Your favourites are available in every project. Open the Favourites tab to rename or delete them.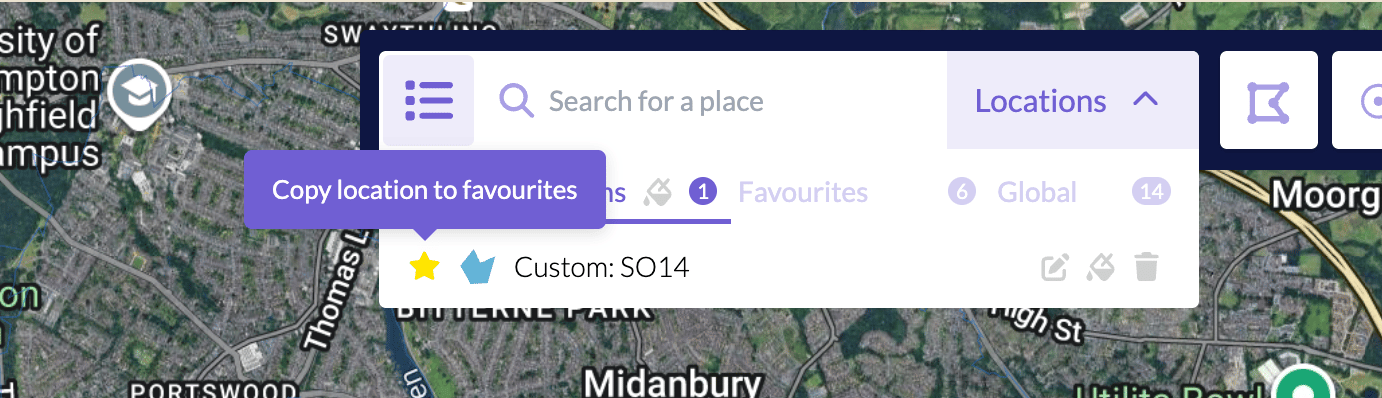
Copy a location to favourites.
Areas covered
REalyse Core covers the whole of the United Kingdom: England, Northern Ireland, Scotland and Wales.Map tools
Measure distances and areas
The measure tool is the ruler icon in the top right corner of the platform.- Click the ruler icon, then click again in the pop-up.
- Click on the map to start measuring.
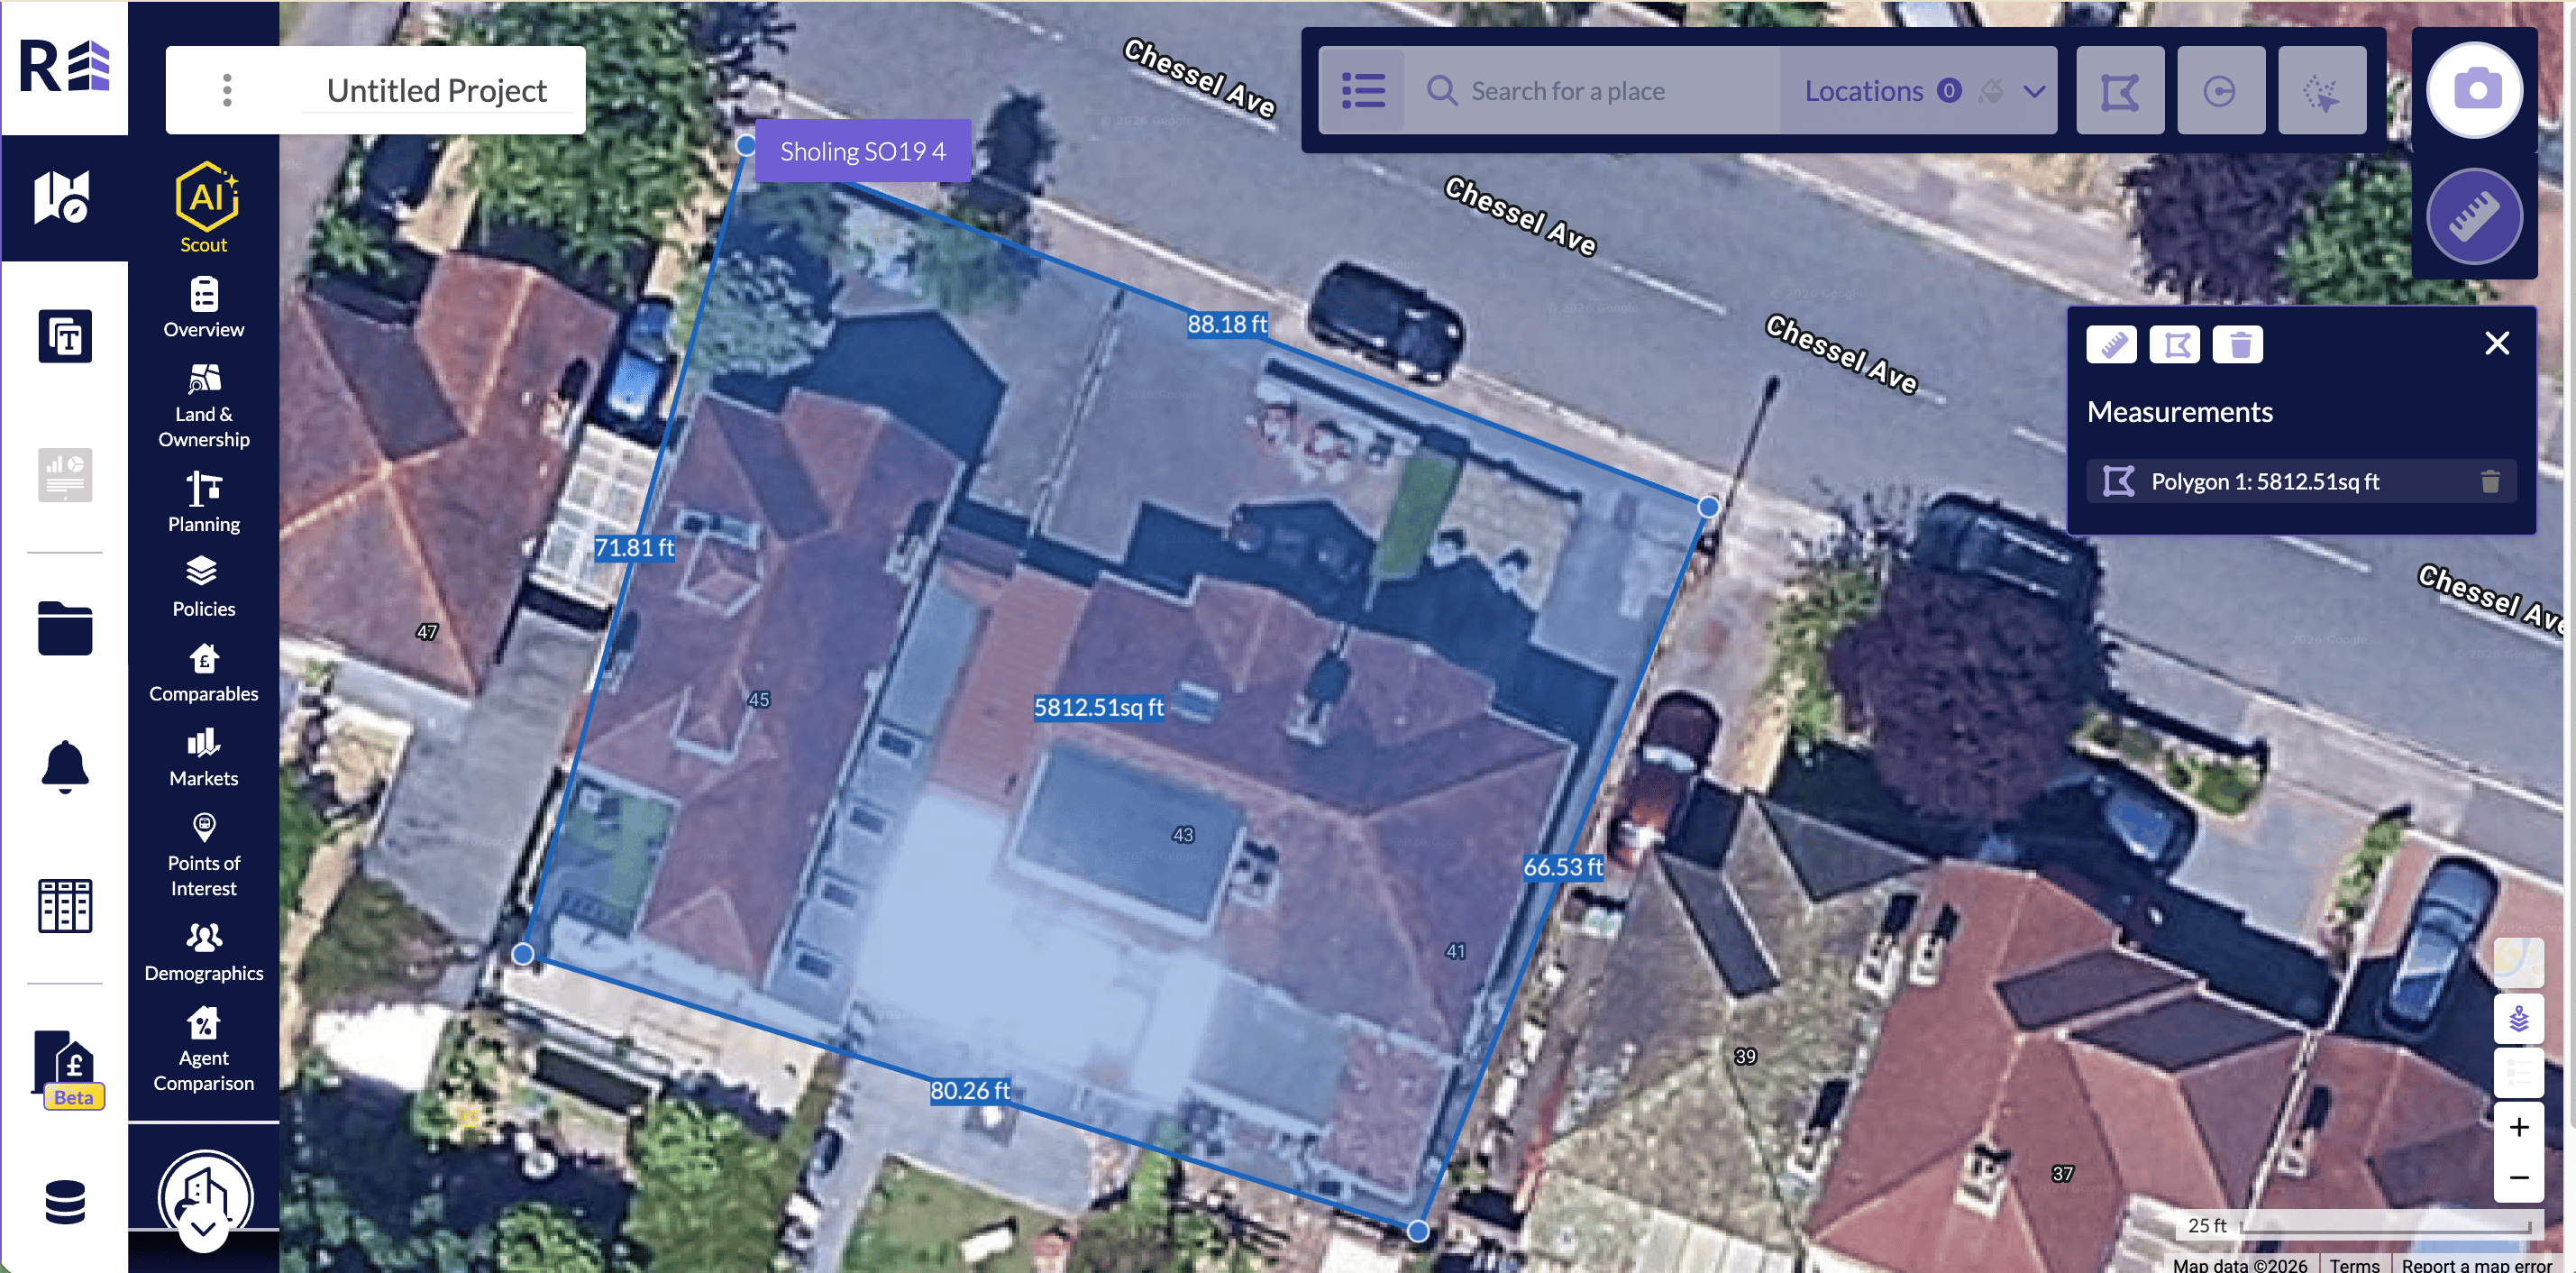
A measurement on the map.
Capture an image
The camera tool is in the top right corner of the platform. When the map shows what you want to keep, click the camera icon to take a screenshot. In Add To Dashboard, choose General or Create New Section, then click Add To Dashboard.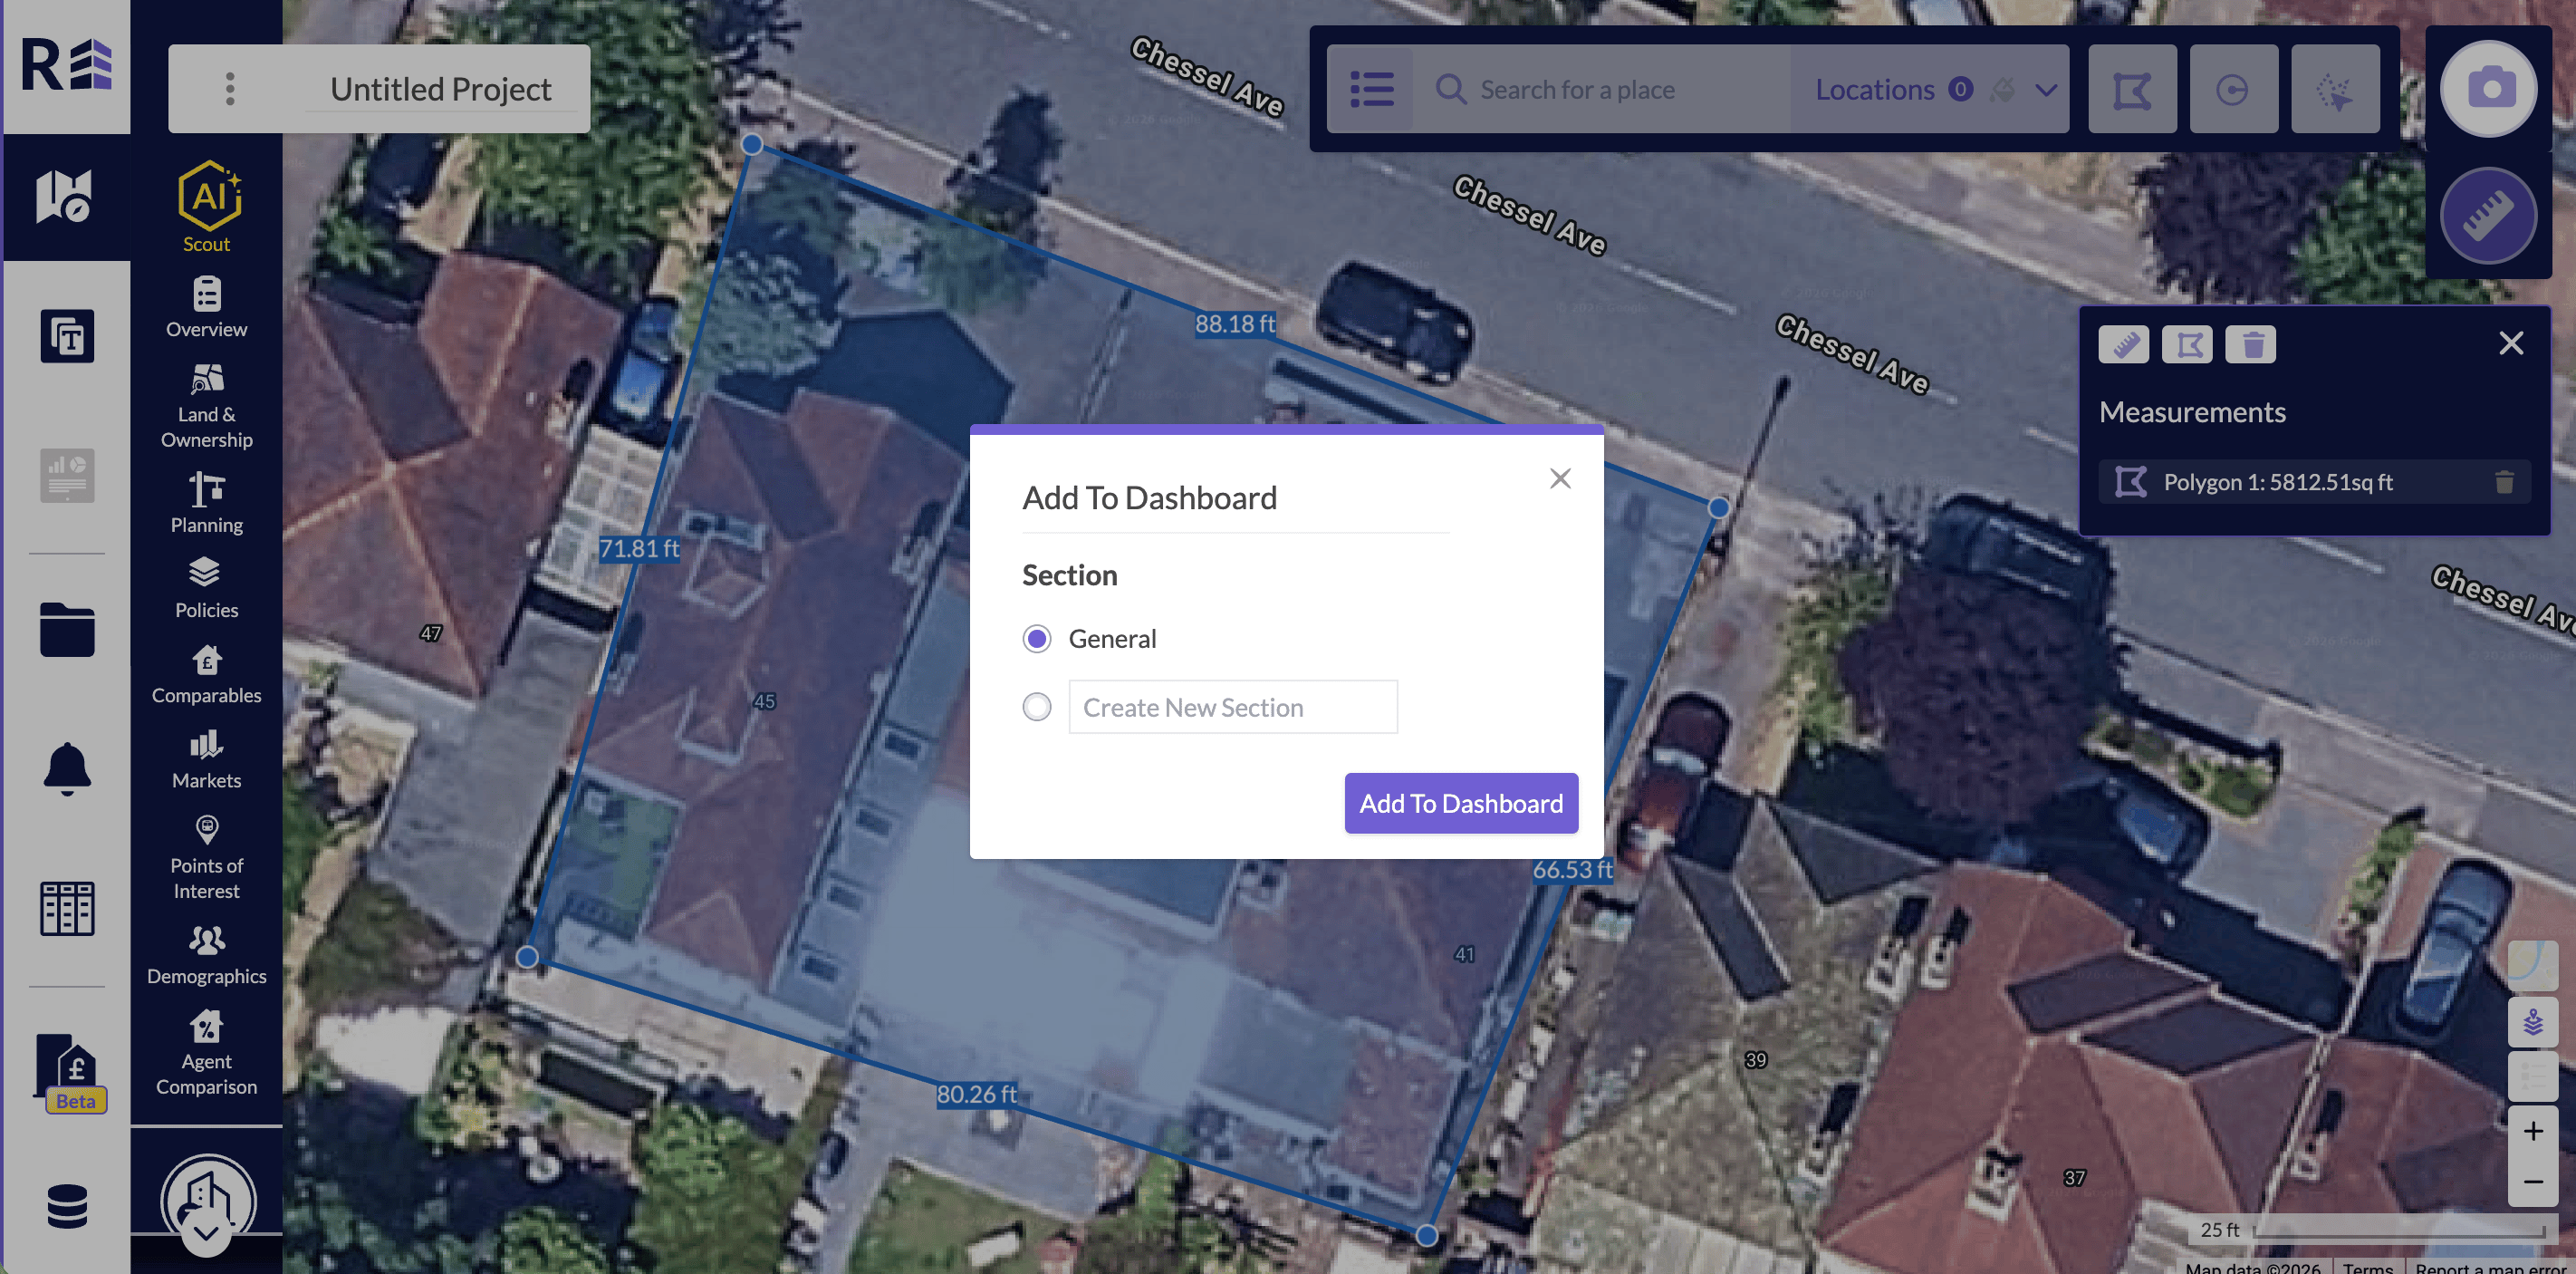
Choose a dashboard section for a captured image.
Layers and legends
The layers and legends panels are in the bottom right corner of the platform.- Layers: Turn data layers on and off to change how your search looks on the map. The panel includes Clear All Layers, Surrounding Area Data, Data Layers, Heat Maps, and Boundaries. You can clear the map back to its original settings here. You can turn layers back on at any time.
- Legends: See what the colours and shapes on the map mean as you add data. For example, Policies can show Land and Land Plots.
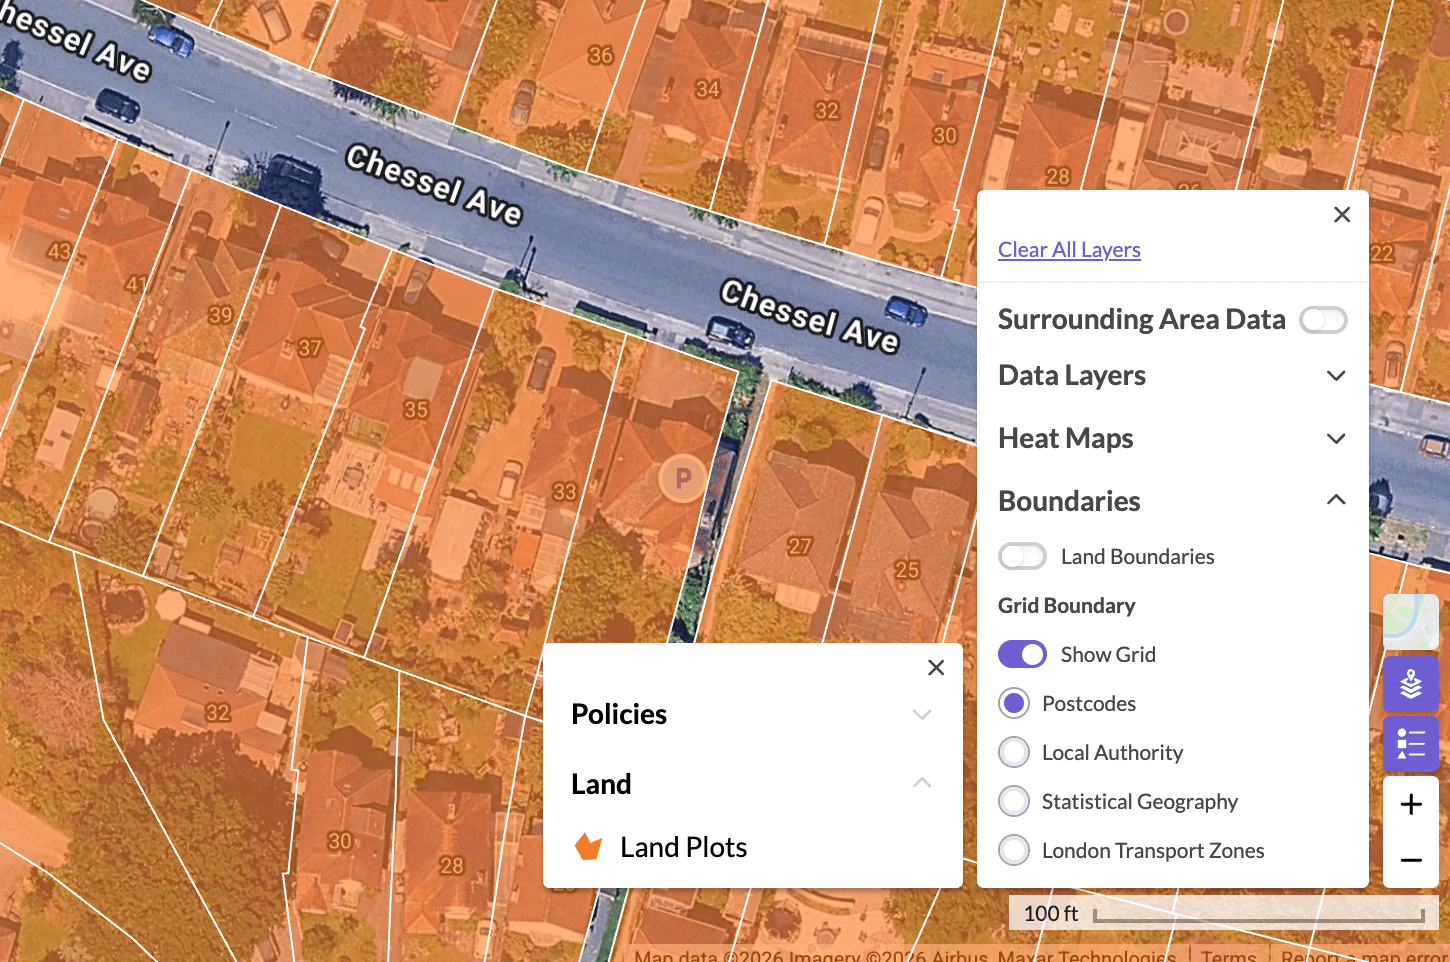
The layers panel and a Land Plots legend.
Heatmaps
Heatmaps show a detailed, local view of your location. They use data points such as transactions or comparables to highlight hot and cold areas. Heatmaps respond to the map view, so they update as you zoom in and out. Open Heat Maps and turn on Show Heatmap. The legend, such as Price Paid - Sales, shows the value bands. By default, heatmaps also show the areas around your location. To show only your saved location, use the Surrounding Area Data toggle in the layers panel.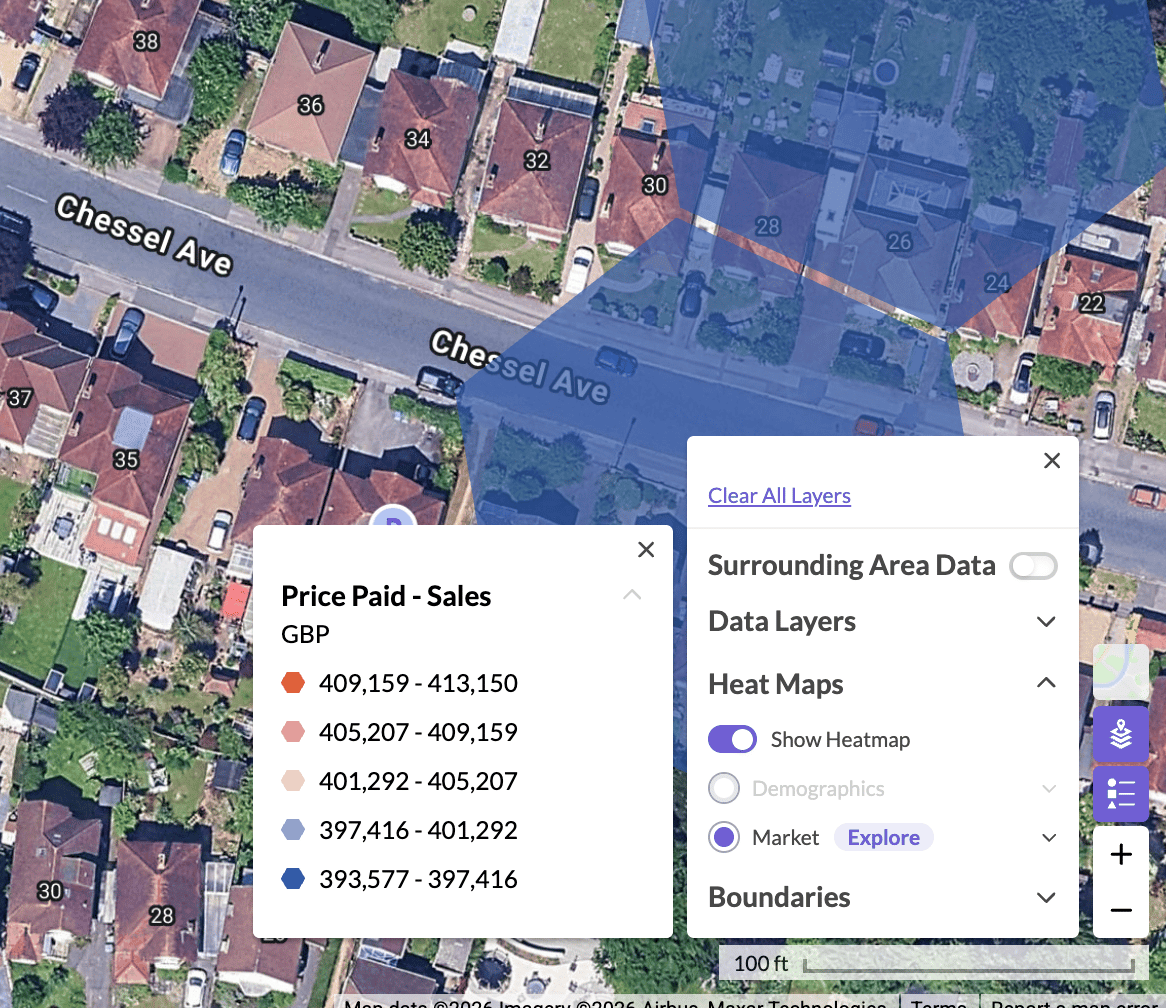
A price paid heatmap and the surrounding data toggle.
Build to Rent (BTR) data
In the planning and markets sections, select the BTR check box to narrow your search to Build to Rent only.Projects
Name a project
Every project starts as Untitled project. To rename it, click the project name in the top left corner and type a new name. The field shows Name a Project. If you forget to rename a project, you do not lose it. It is saved as untitled.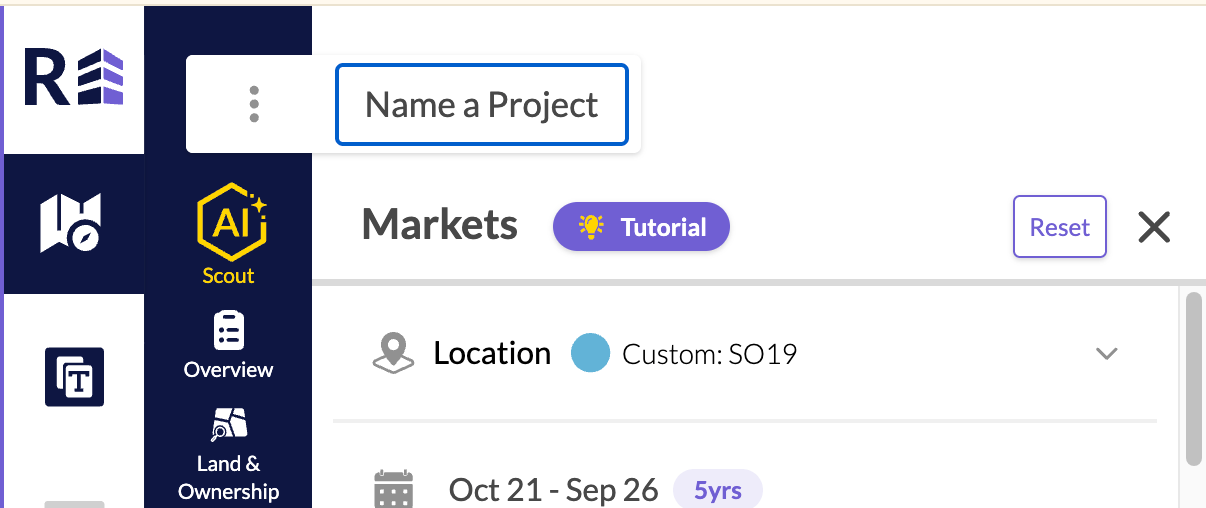
The project name field.
Save a project
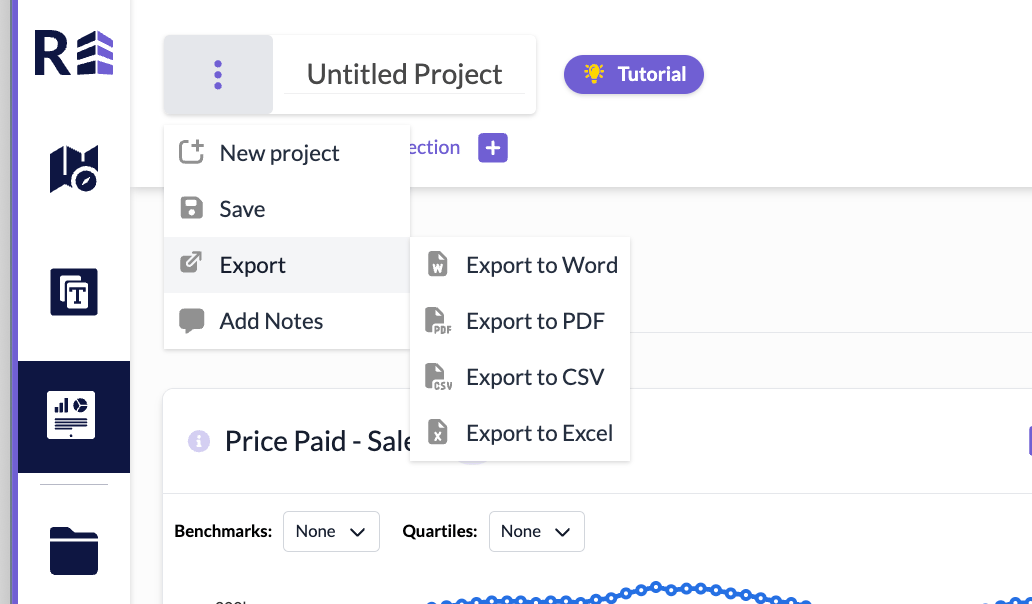
Projects save automatically as you work. Rename your project when you start, so everything is saved under that name. To save manually, click the three dots to the left of the project name and choose Save. Your project then appears in All Projects in the left sidebar.Find a project
Open the folder icon in the left sidebar to see all your projects.Organise your projects
In All Projects, click the plus icon at the top of the page to add a new group. To add a project to a group, use the three dots on the project tile, or drag the project into the group.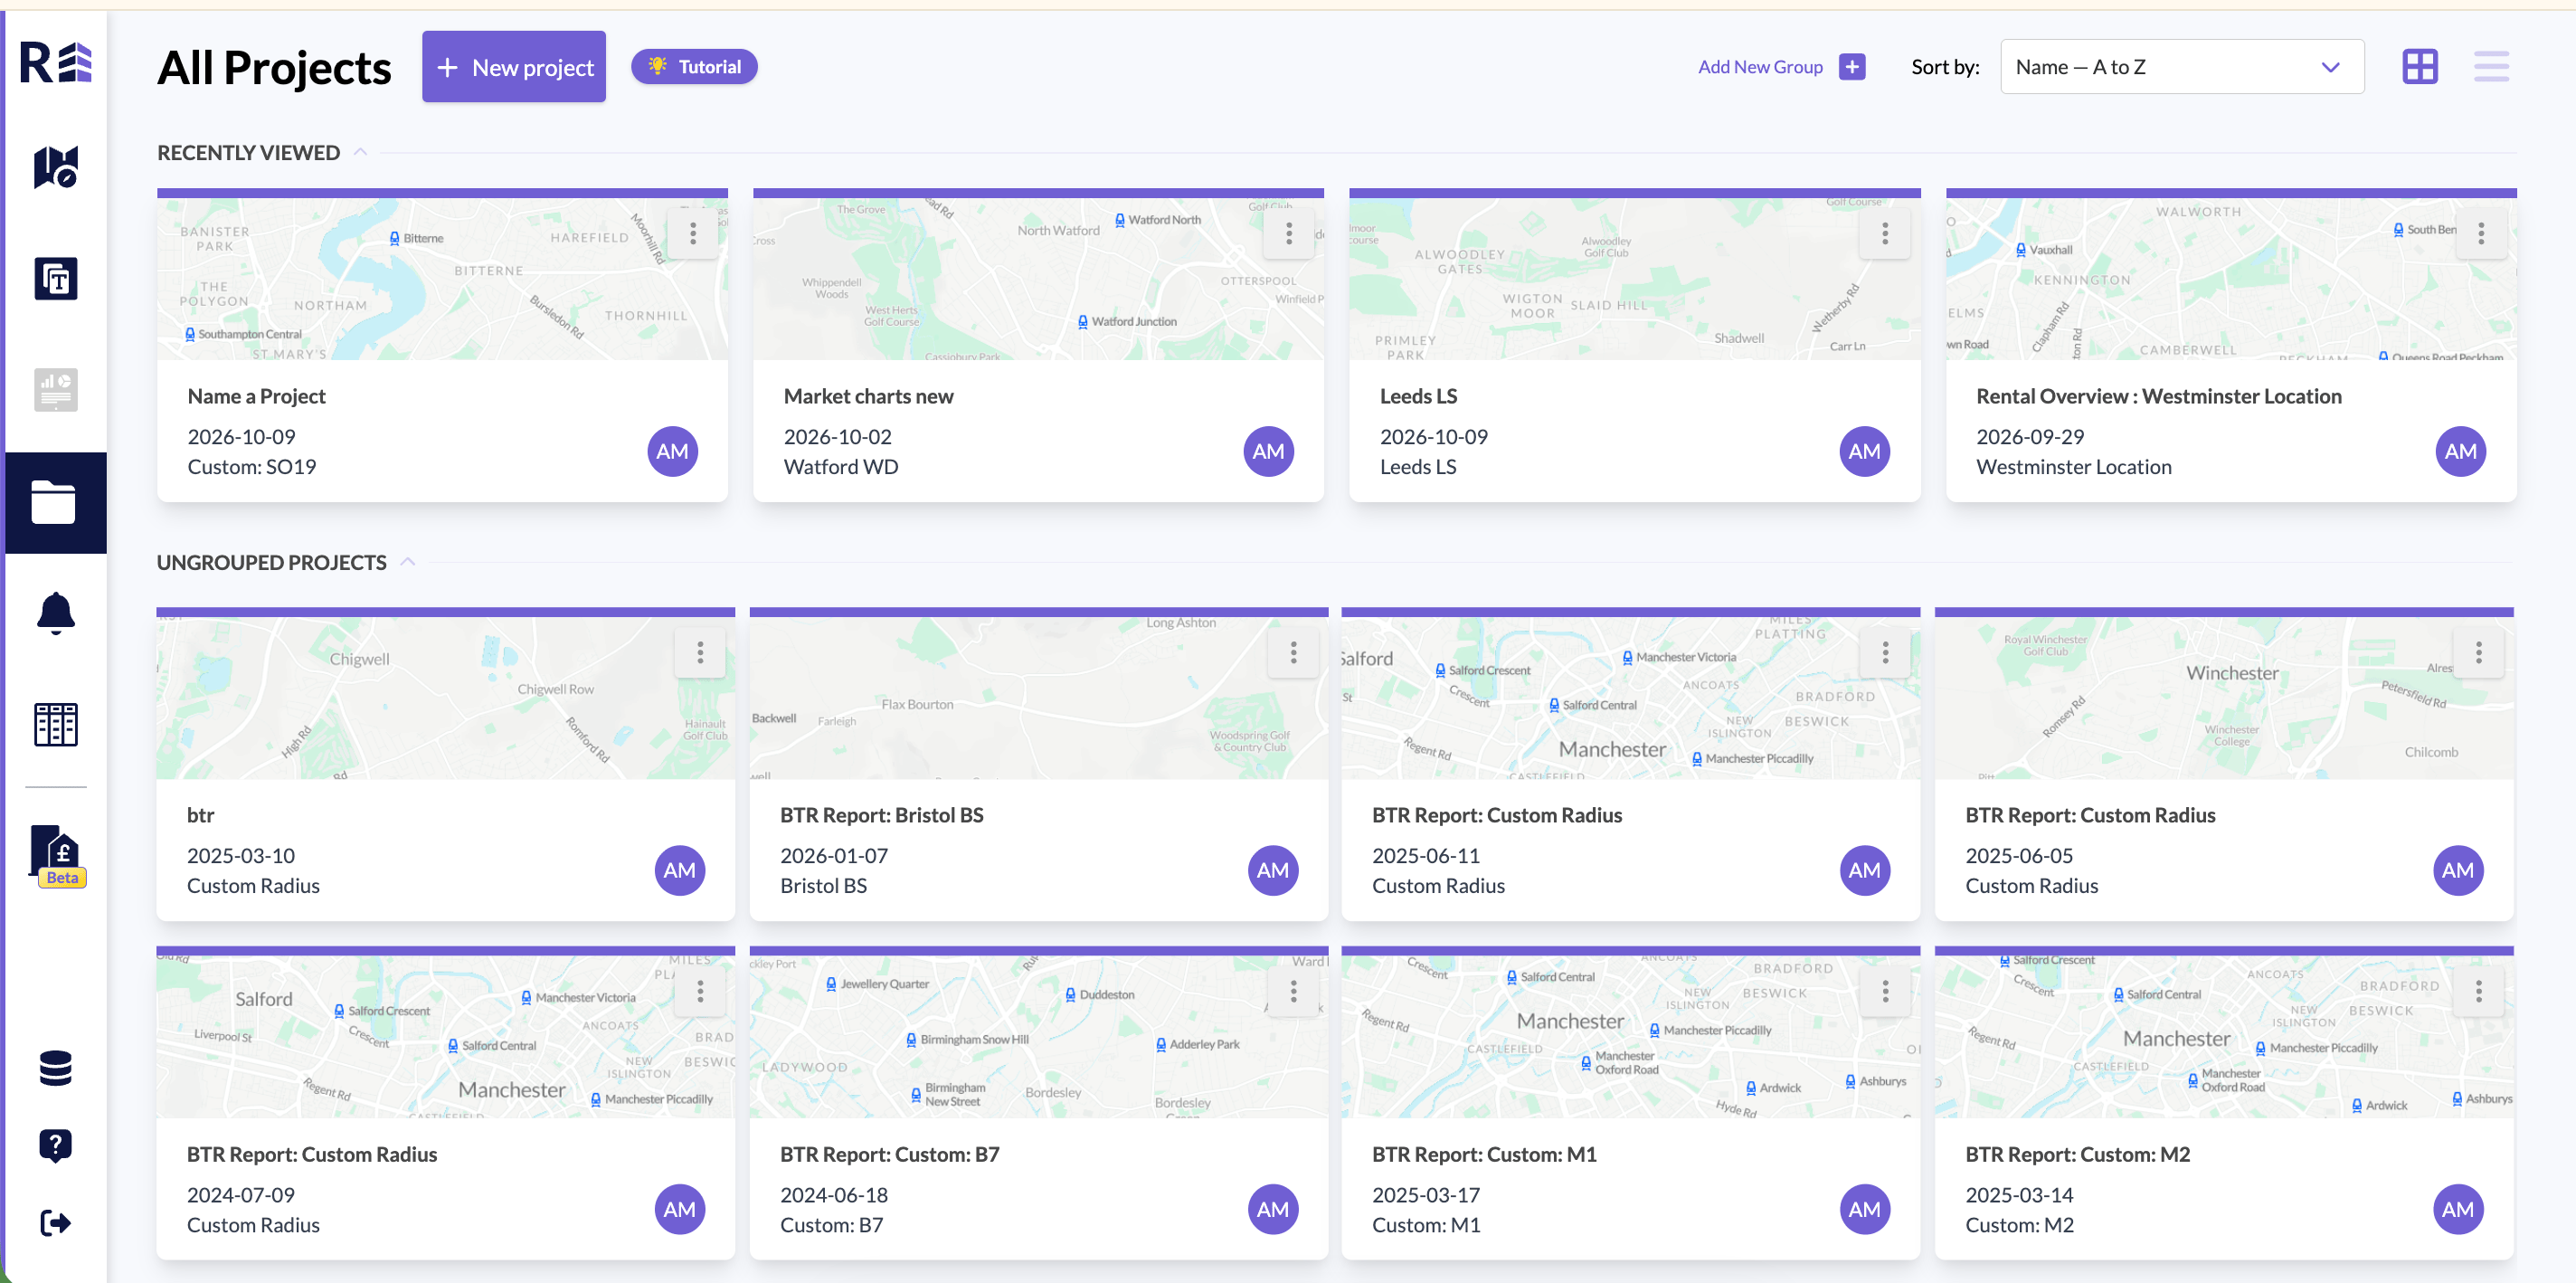
Share a project
Projects belong to one user and cannot be shared with other users. To let a colleague use your research, share a template with your team instead. See Templates.Exports
Download or export data
You can export data from tiles at different stages of your search. In Explore:- Export a PNG: Downloads the data as an image to your downloads folder. You cannot edit a graph that you download as an image.
- Export records: Downloads the raw data from a graph or list as an Excel file to your downloads folder.
- Export to Word: Sends the full dashboard to your email as a Word document.
- Export to CSV: Downloads the data as a series of Excel files.
Export records
When you have a list of results for your saved location, click the downward arrow icon in the results panel. Your results download as a CSV file that you can open in Excel. You can find the file in your downloads folder.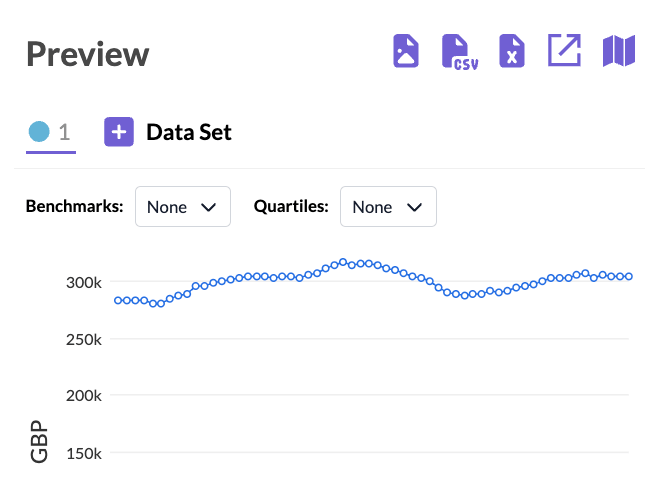
Data sources and updates
See where data comes from
Click the ? icons in the Explore tabs. Each one expands to show the methodology and the sources for that dataset.See how often data is updated
Click the ? icons in the Explore tabs. Each one shows how often that dataset is updated.Account and support
Add or remove users
Contact your customer success manager to make any changes to your users. They can also run an onboarding session for new team members.Share login details
You cannot share login details. Each subscription is for one user per login. Each extra person in your organisation needs their own licence.Get the latest version
When a new version of REalyse is released, you see the message A new version of REalyse is available. Click Refresh to reload the page. You are then on the latest version. The message does not close on its own. REalyse checks for a new version every few minutes. It also checks when you return to the tab. Screenshot needed: The new version message with the Refresh button beside it.Report an issue
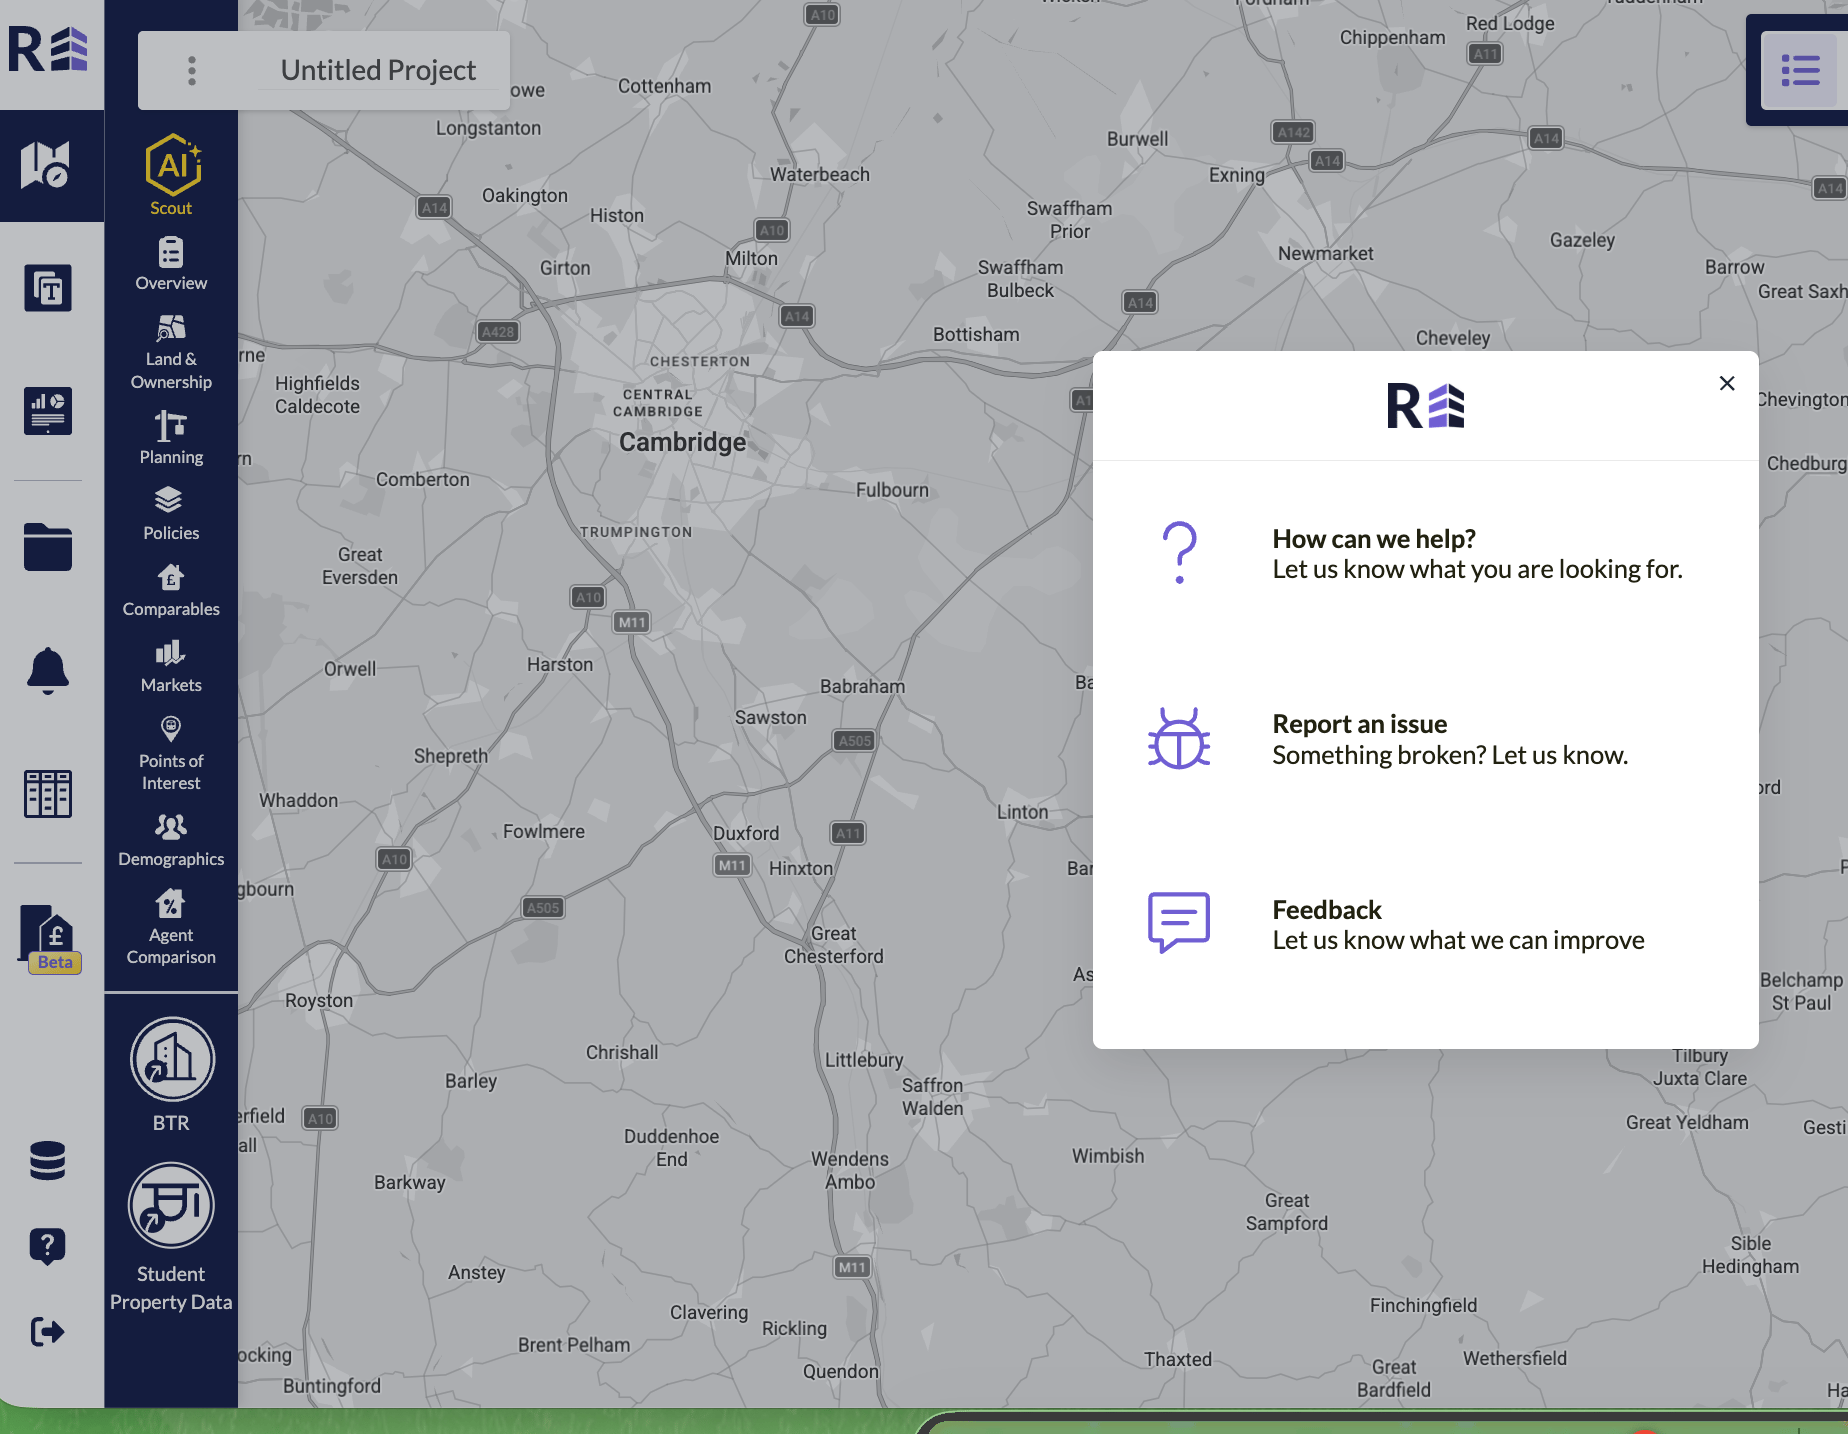
Click the speech bubble icon in the bottom left corner of the platform. You then have three options:- Ask a question: Use this if you are unsure about something. Your question is emailed to the support team.
- Report an issue: Use this if something is not working, data is missing or the platform does not load correctly. Include as much detail as you can, such as a screenshot or screen recording and the steps to reproduce the issue.
- Share feedback: Use this to suggest a feature improvement or give general feedback.