

Where the data comes from
Planning data comes from Glenigan. It is updated weekly.What data is available
REalyse Core shows residential planning applications. Each application includes key details such as the start date, number of units and description. Where possible, you also get a link to the planning portal and contact details for the people involved.See planning applications on the map
Choose your search criteria and click Apply. The map fills with coloured bubbles of different sizes. The size and colour show the size and stage of each application. The Planning legend explains what each one means: bubble size shows the Number of Units, and colour shows the Stage (Completed, In Construction, Granted, In Progress, Refused or Withdrawn). Matching records are listed in the left panel.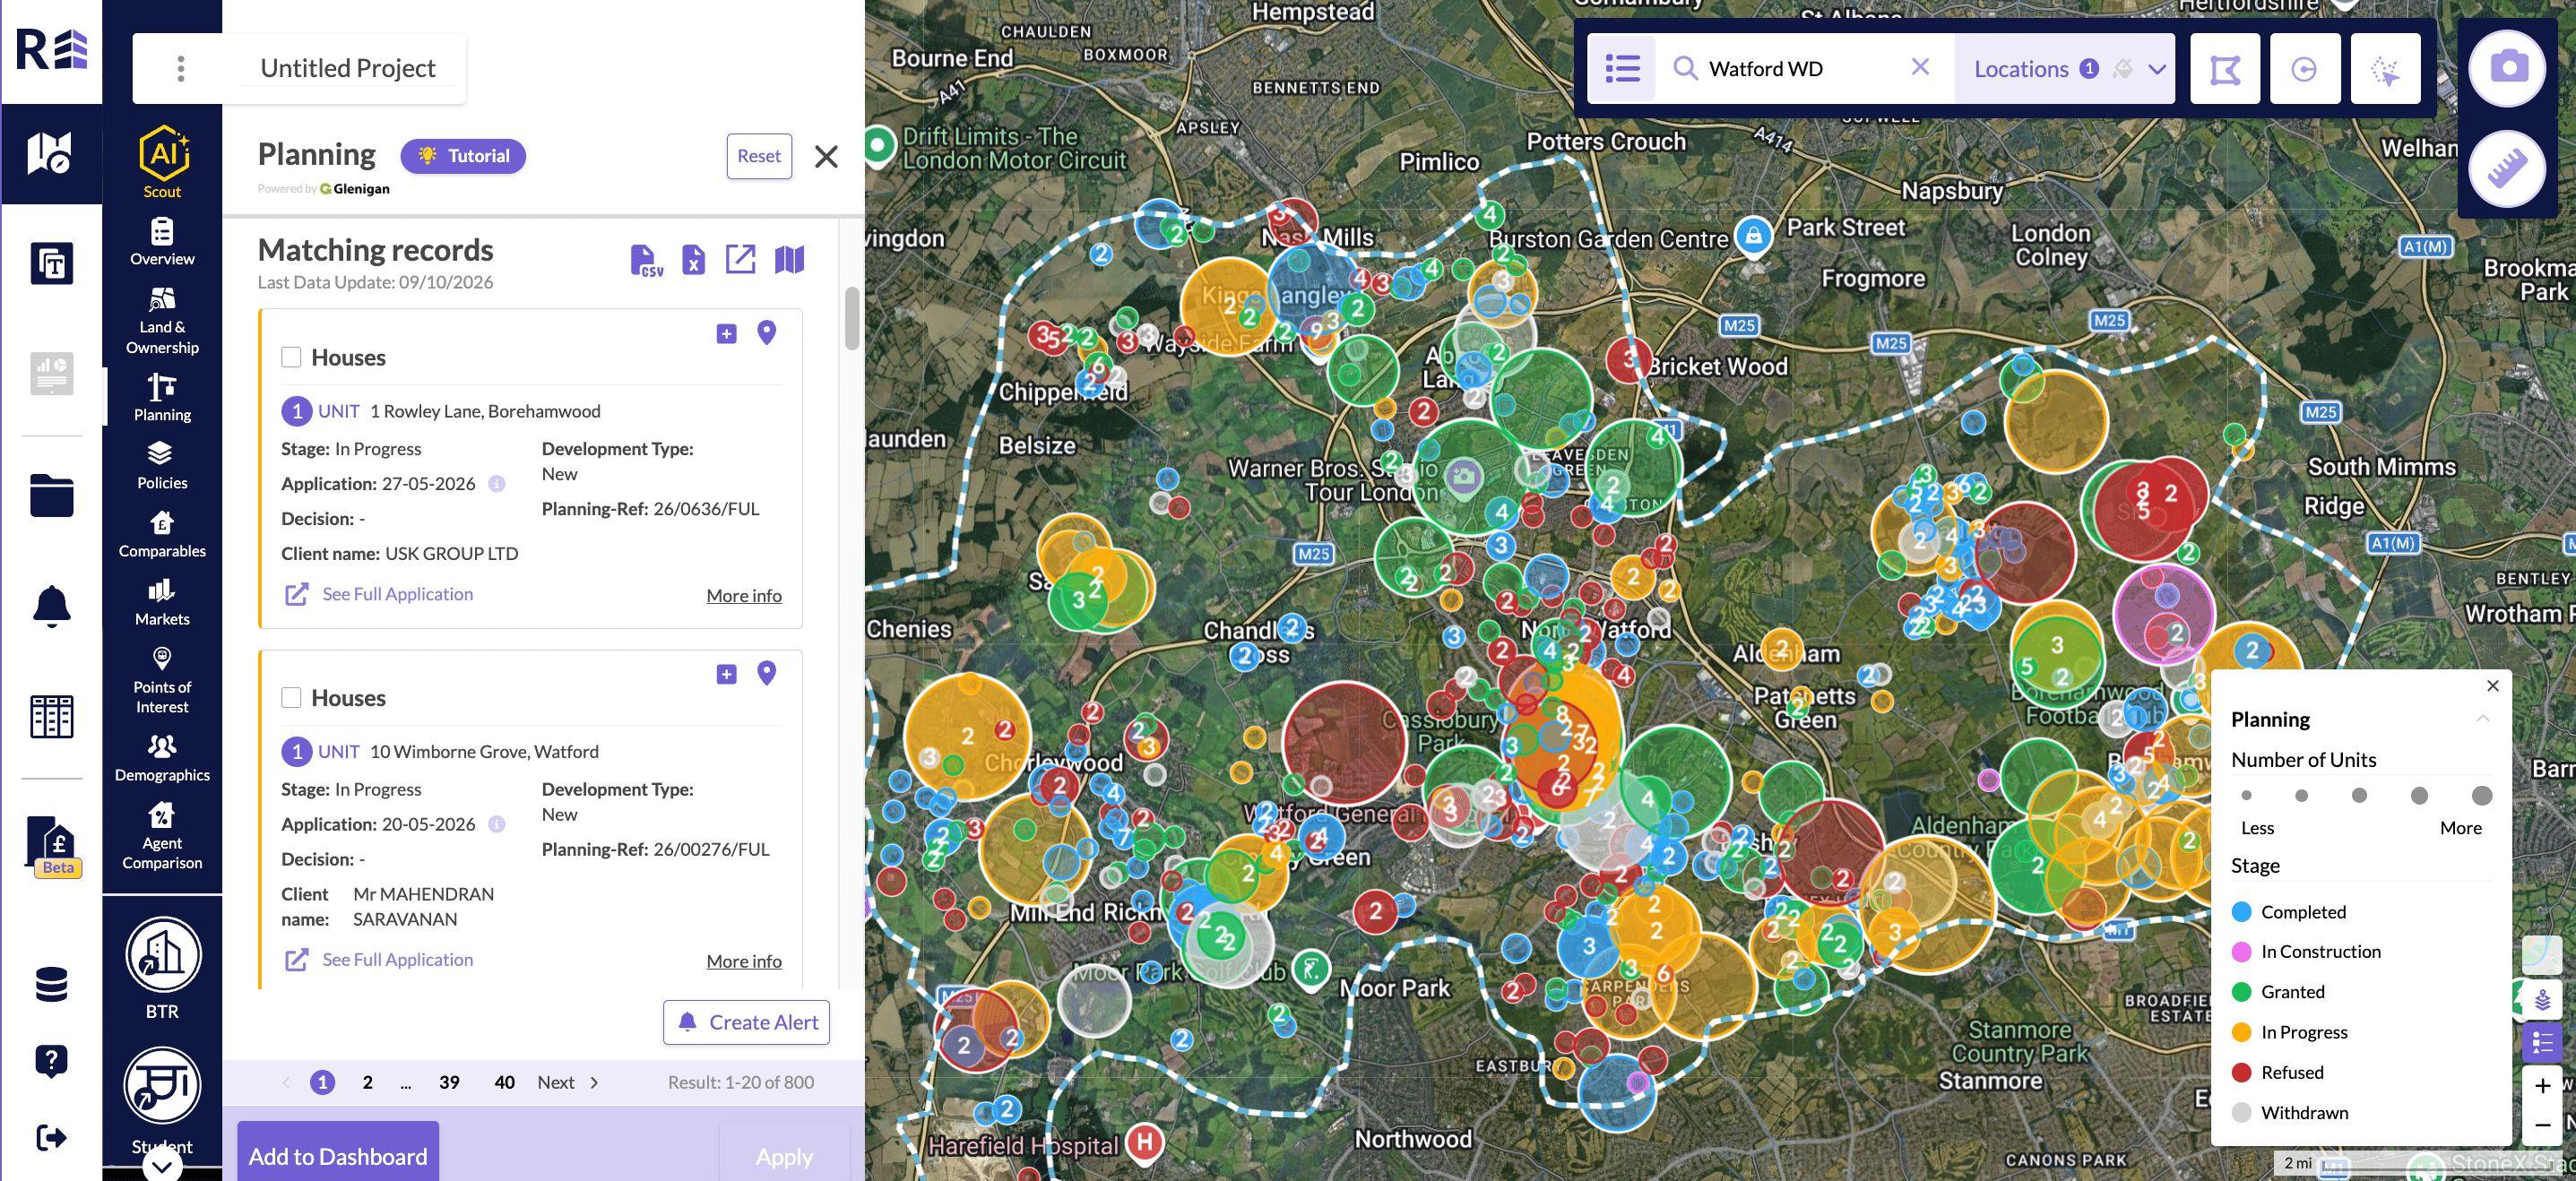
Planning applications on the map, with the Planning legend open.
Search for a company
You can search for a company in the planning section of Explore. Use this to learn about a specific developer, see who is most active in an area, or find a developer’s sites across a city or the country.See pipeline information
The planning and construction pipelines are in the planning section, under data sets. Each one is a chart based on the date planning was applied for, or the date construction is due to end. Choose Planning Pipeline under Data Set to open a Preview bar chart of units by Application Submitted Date, coloured by stage.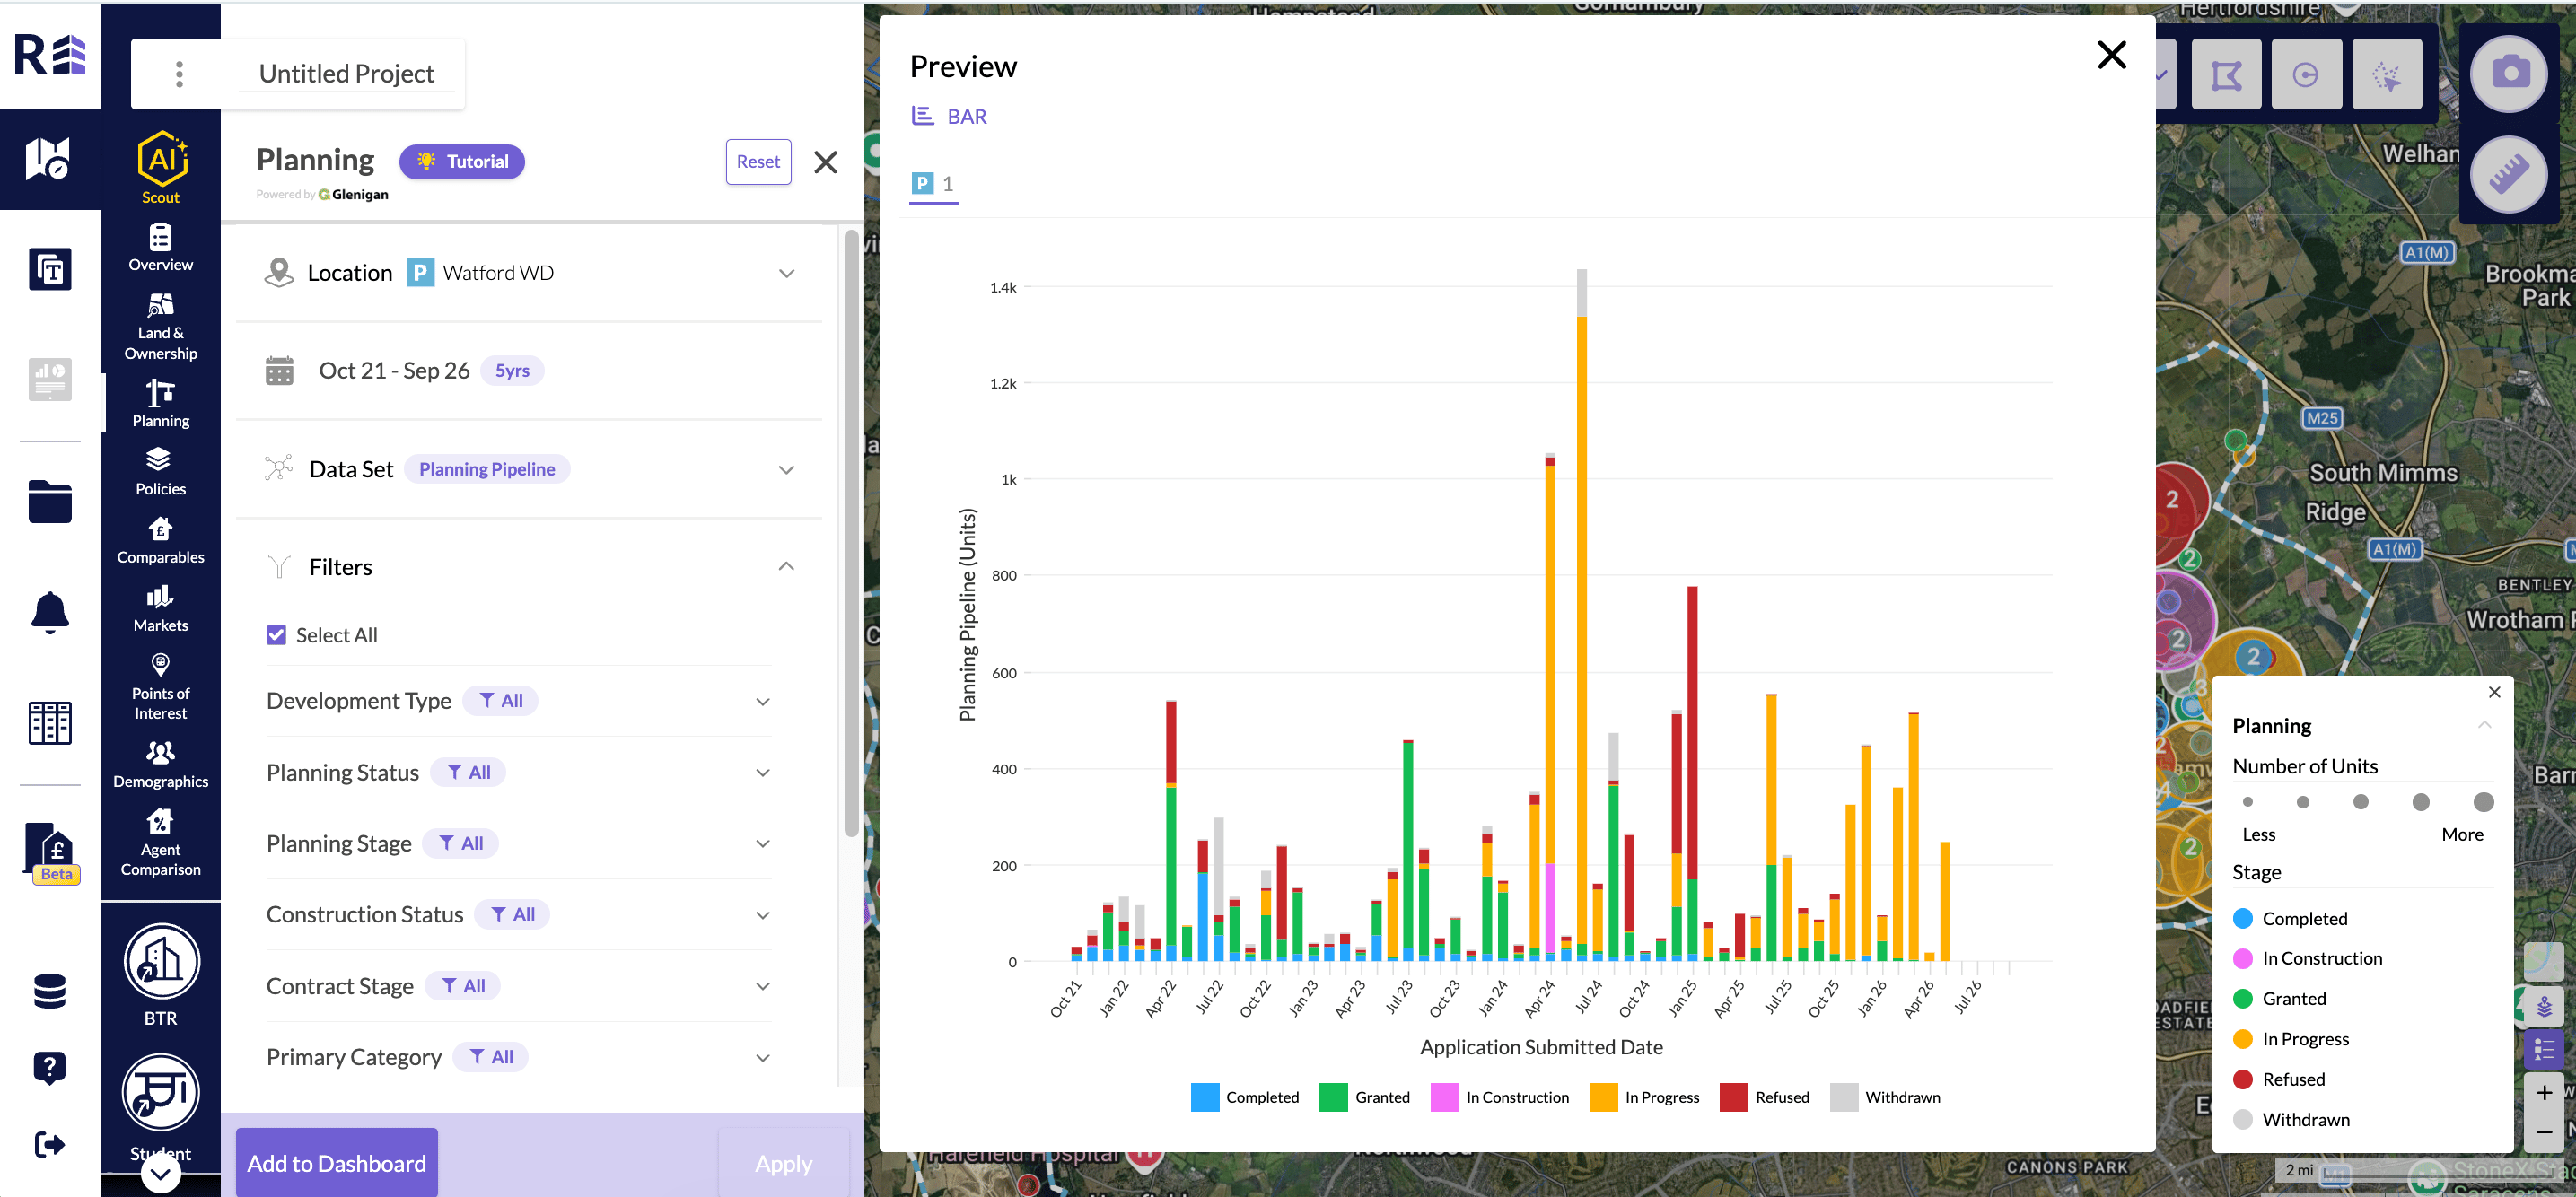
The Planning Pipeline chart in the Preview window.
Open the local planning portal
Click See Full Application on a record to open the local planning portal for that application. The link is on each record in the matching records list and at the bottom of Planning Record Details.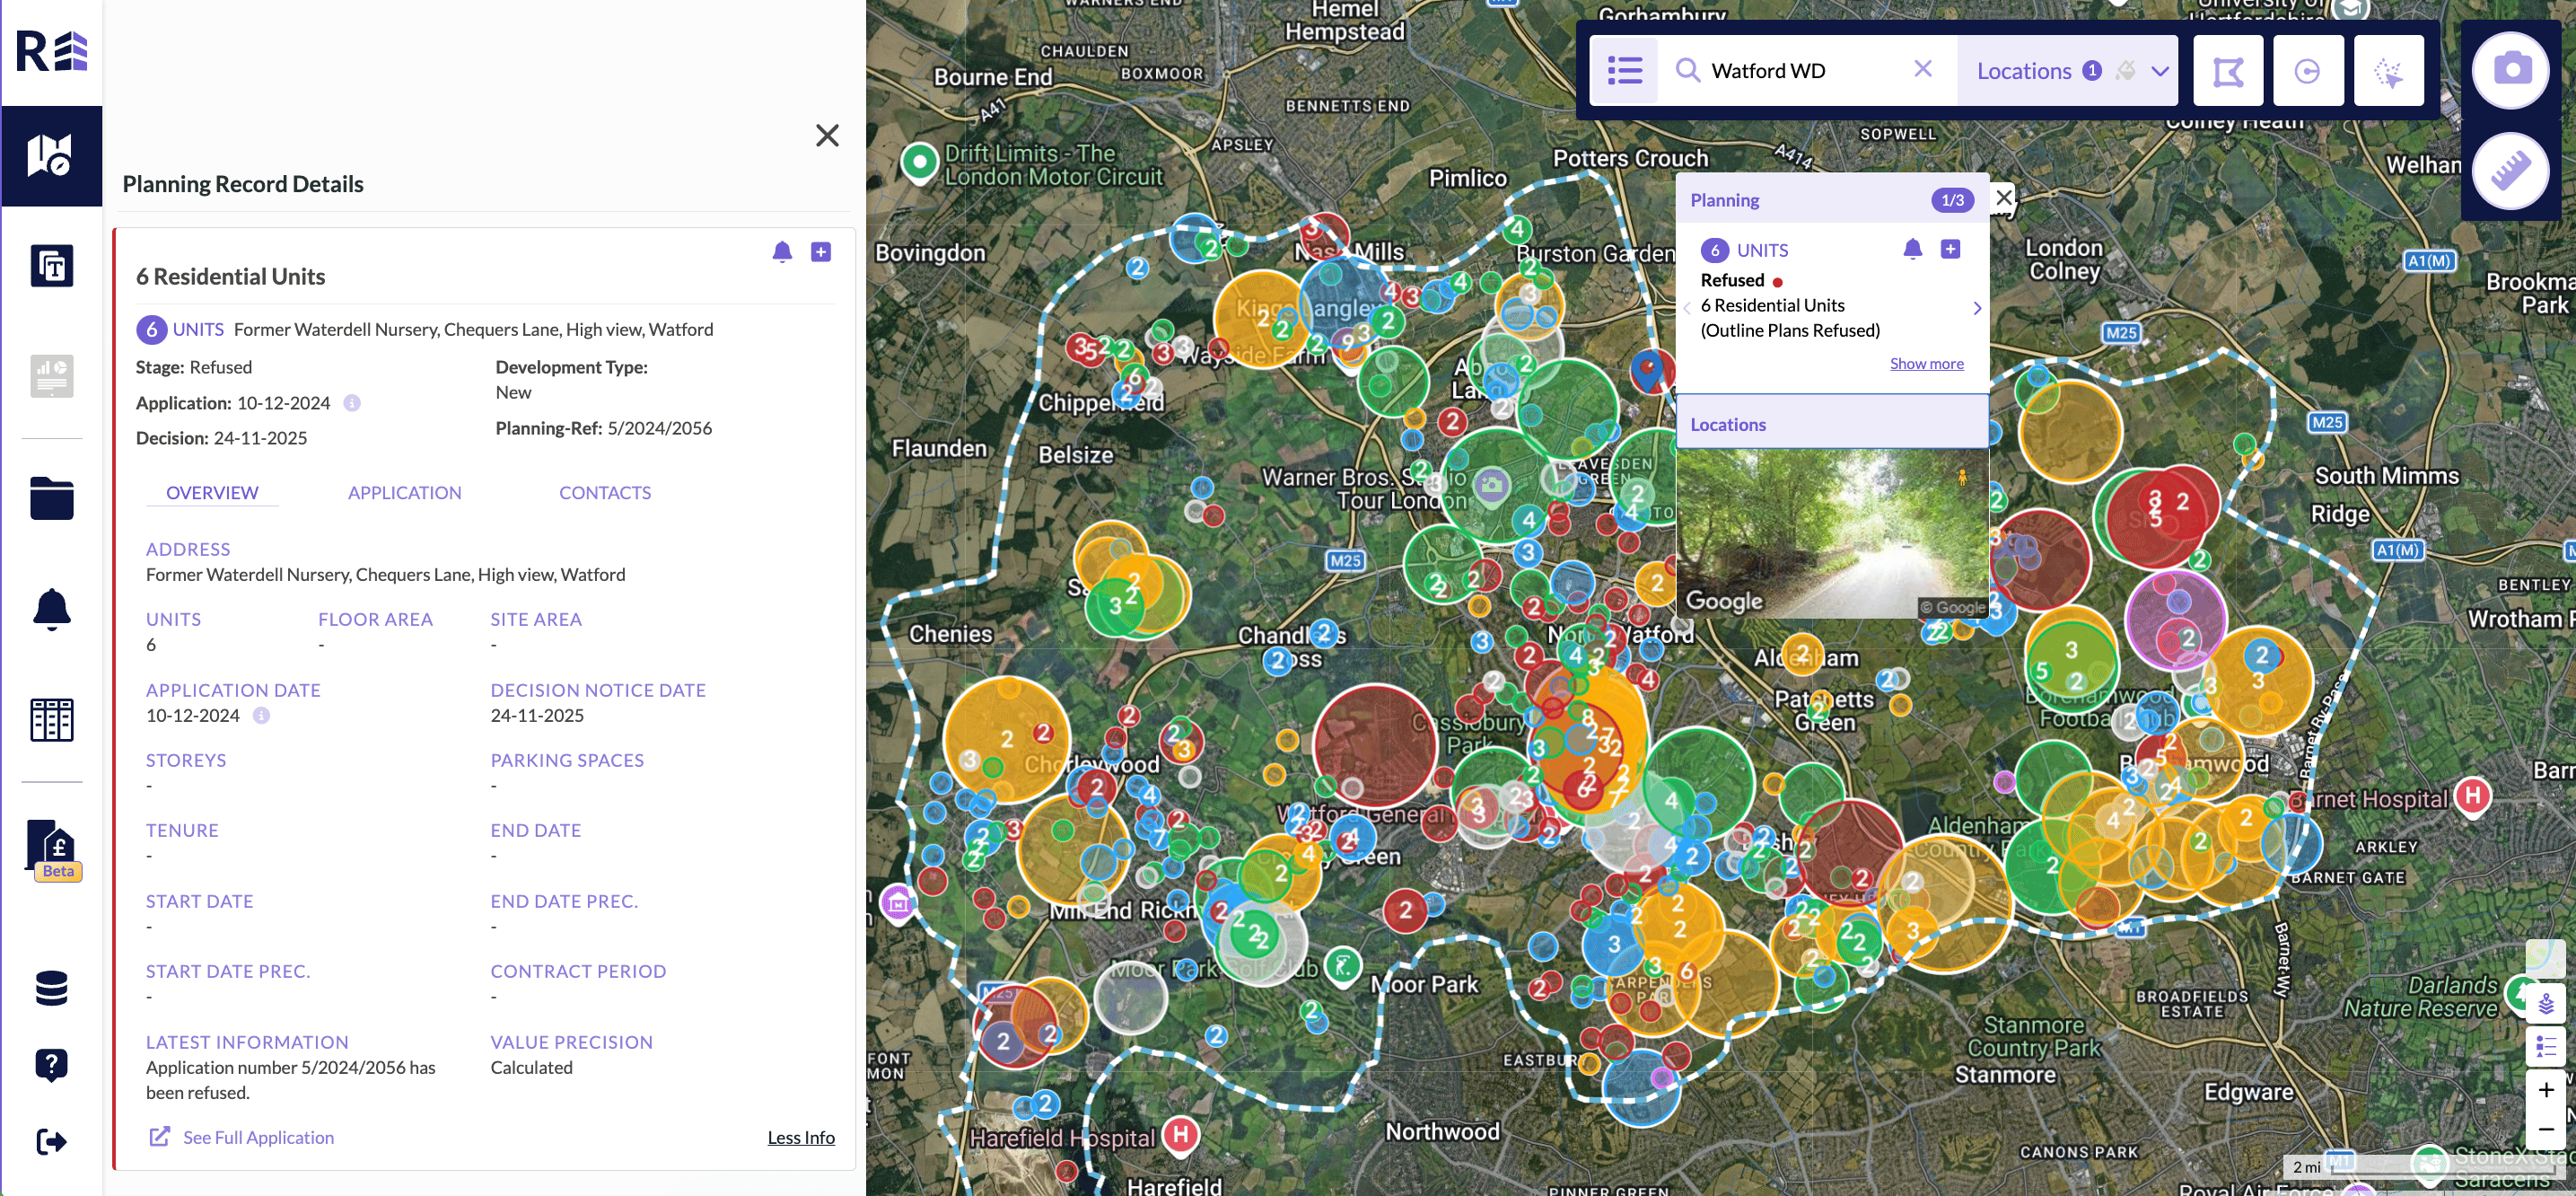
Planning Record Details with the See Full Application link.