Where the data comes from
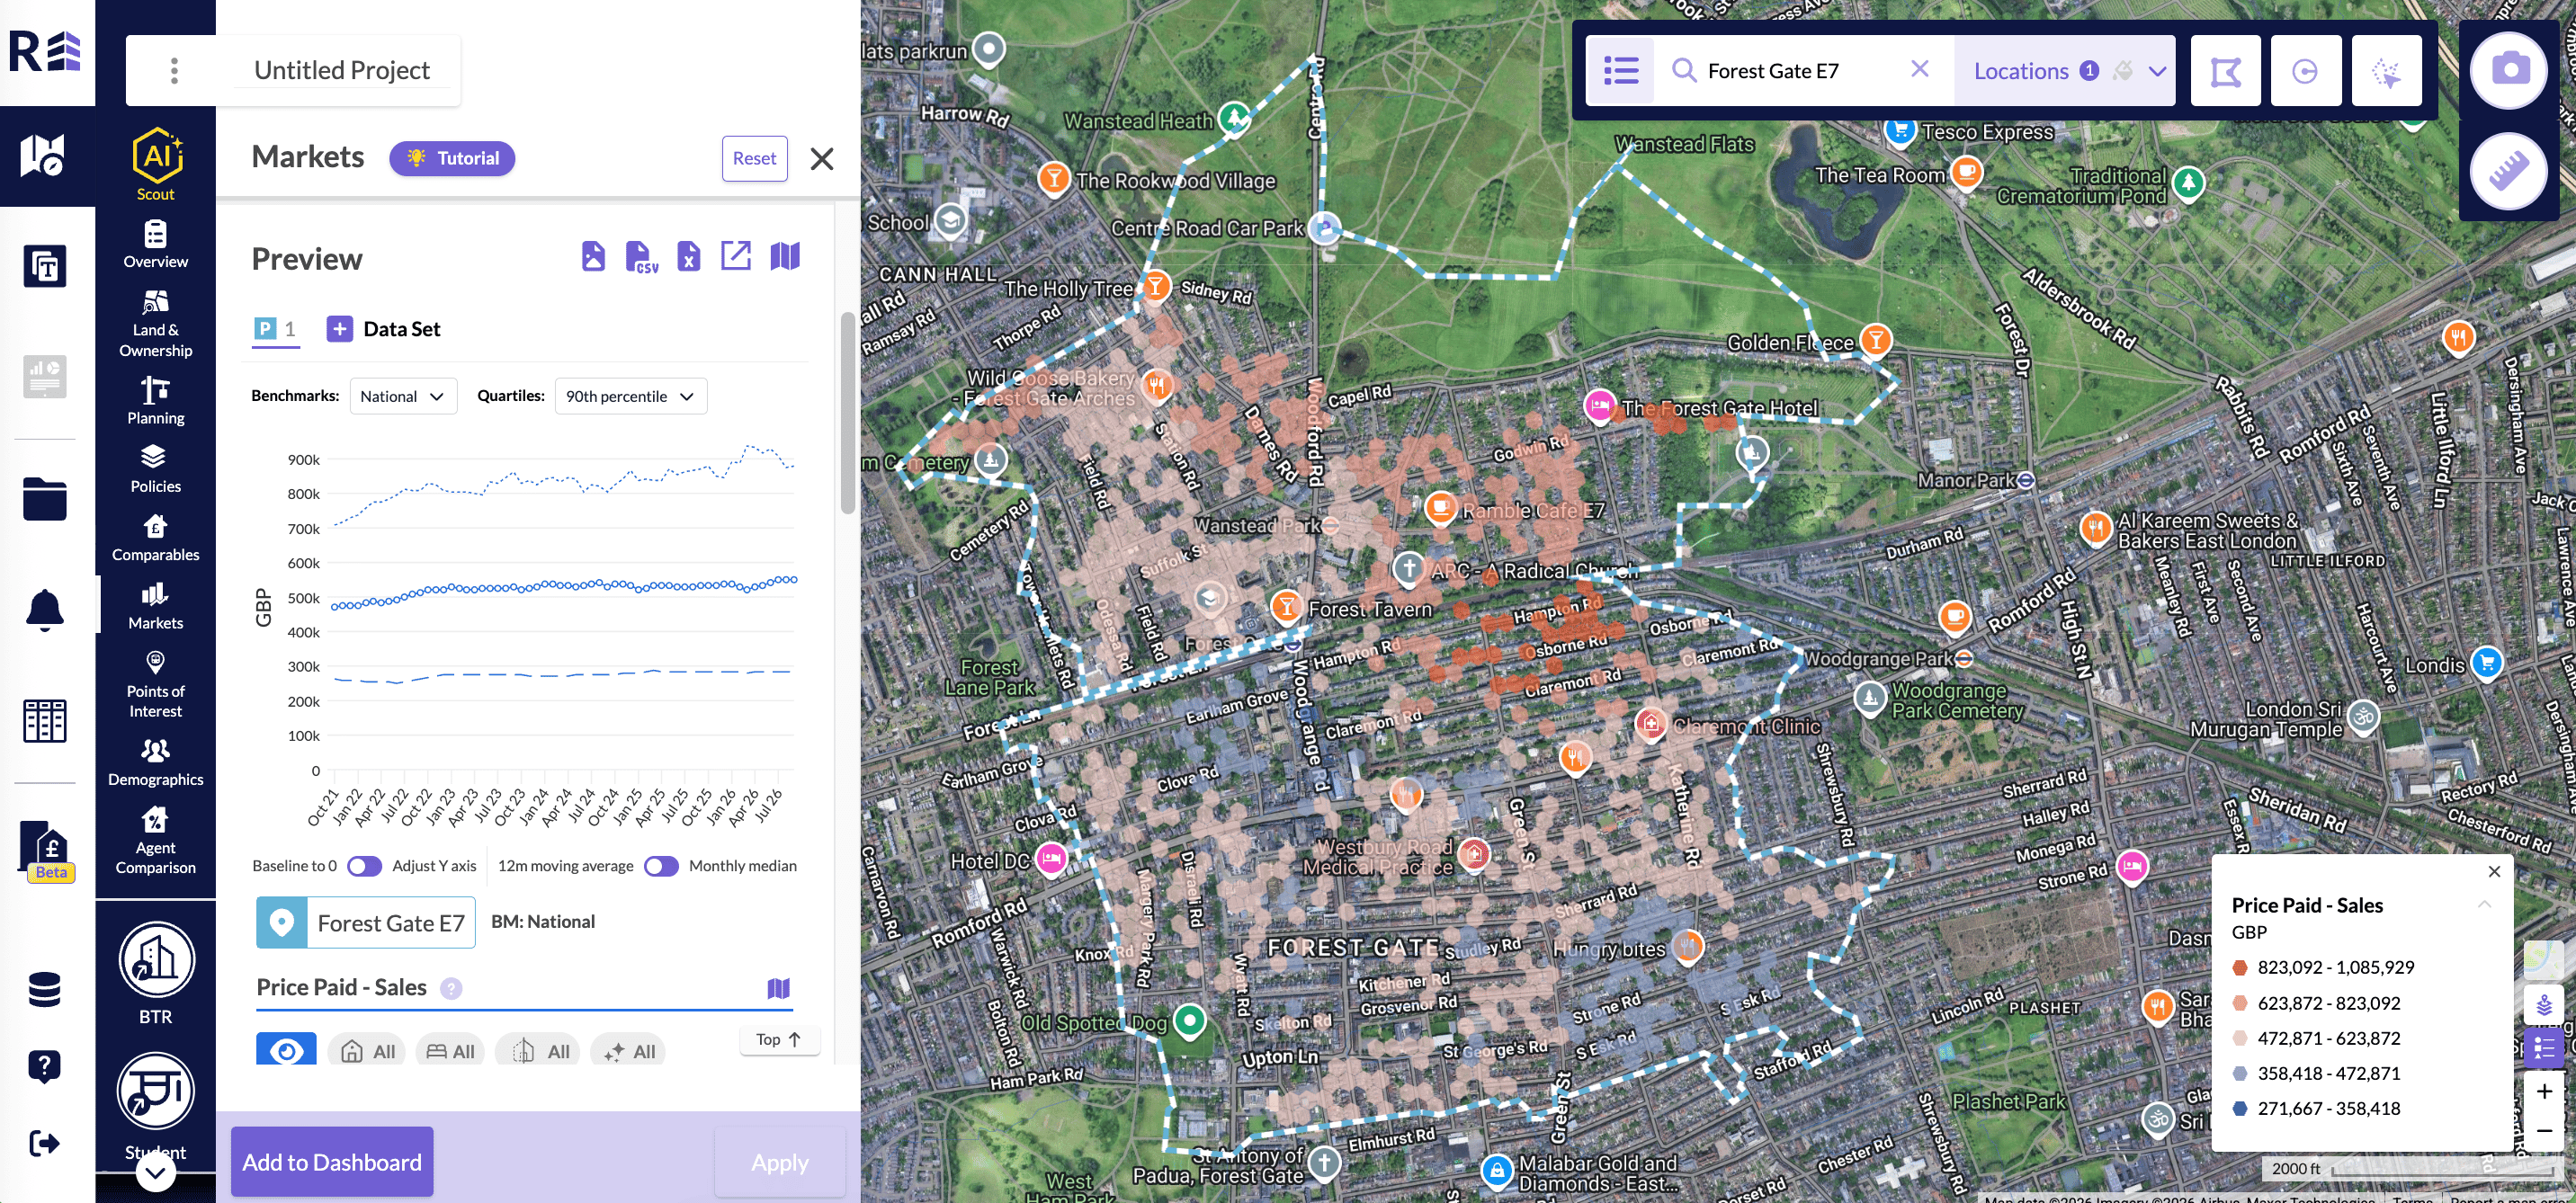
Markets data comes from HM Land Registry and from various property listing sites, which REalyse de-duplicates. It is updated weekly and goes back to 1995. Click the ? icon next to any filter to see where that dataset comes from and how often it is updated.Build a time series graph
- Select the time period you want.
- Select either one or two sales indicators you want to analyse.
- Click Apply.
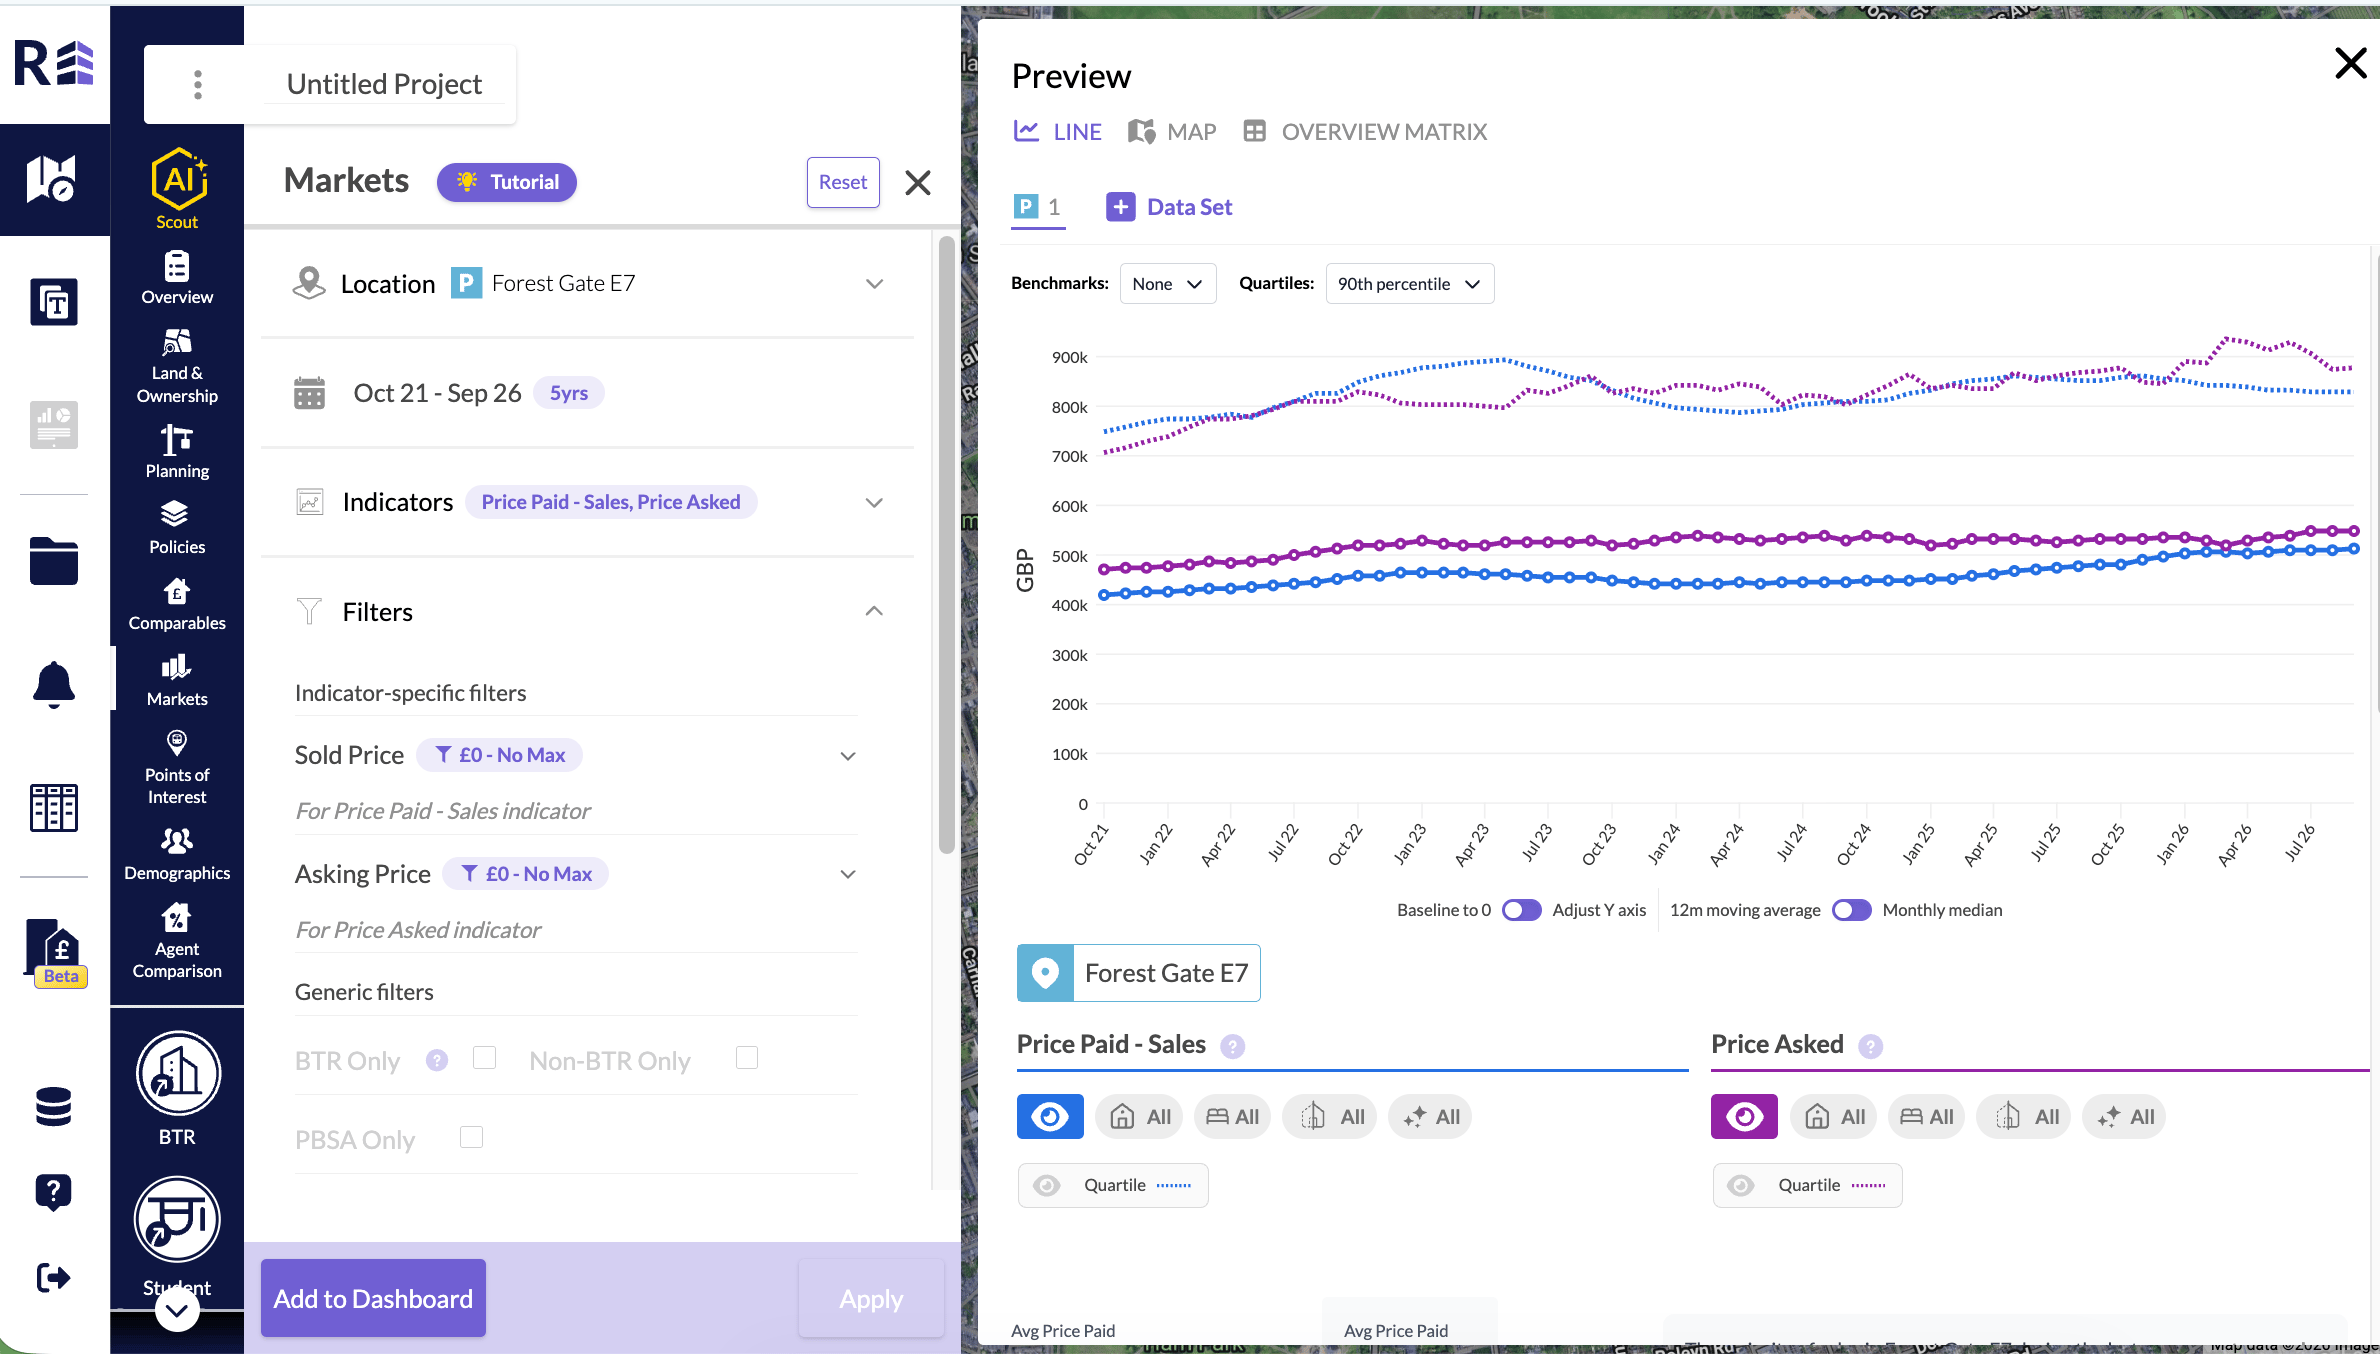
Add a line to a graph
Adding a line to a graph is called adding a data-set. Use it to compare sets of data, such as the rent price in two locations. When you have a graph in markets, the option to add a data-set appears next to your first location. You can add another location, or another filter, such as flats against terraced houses.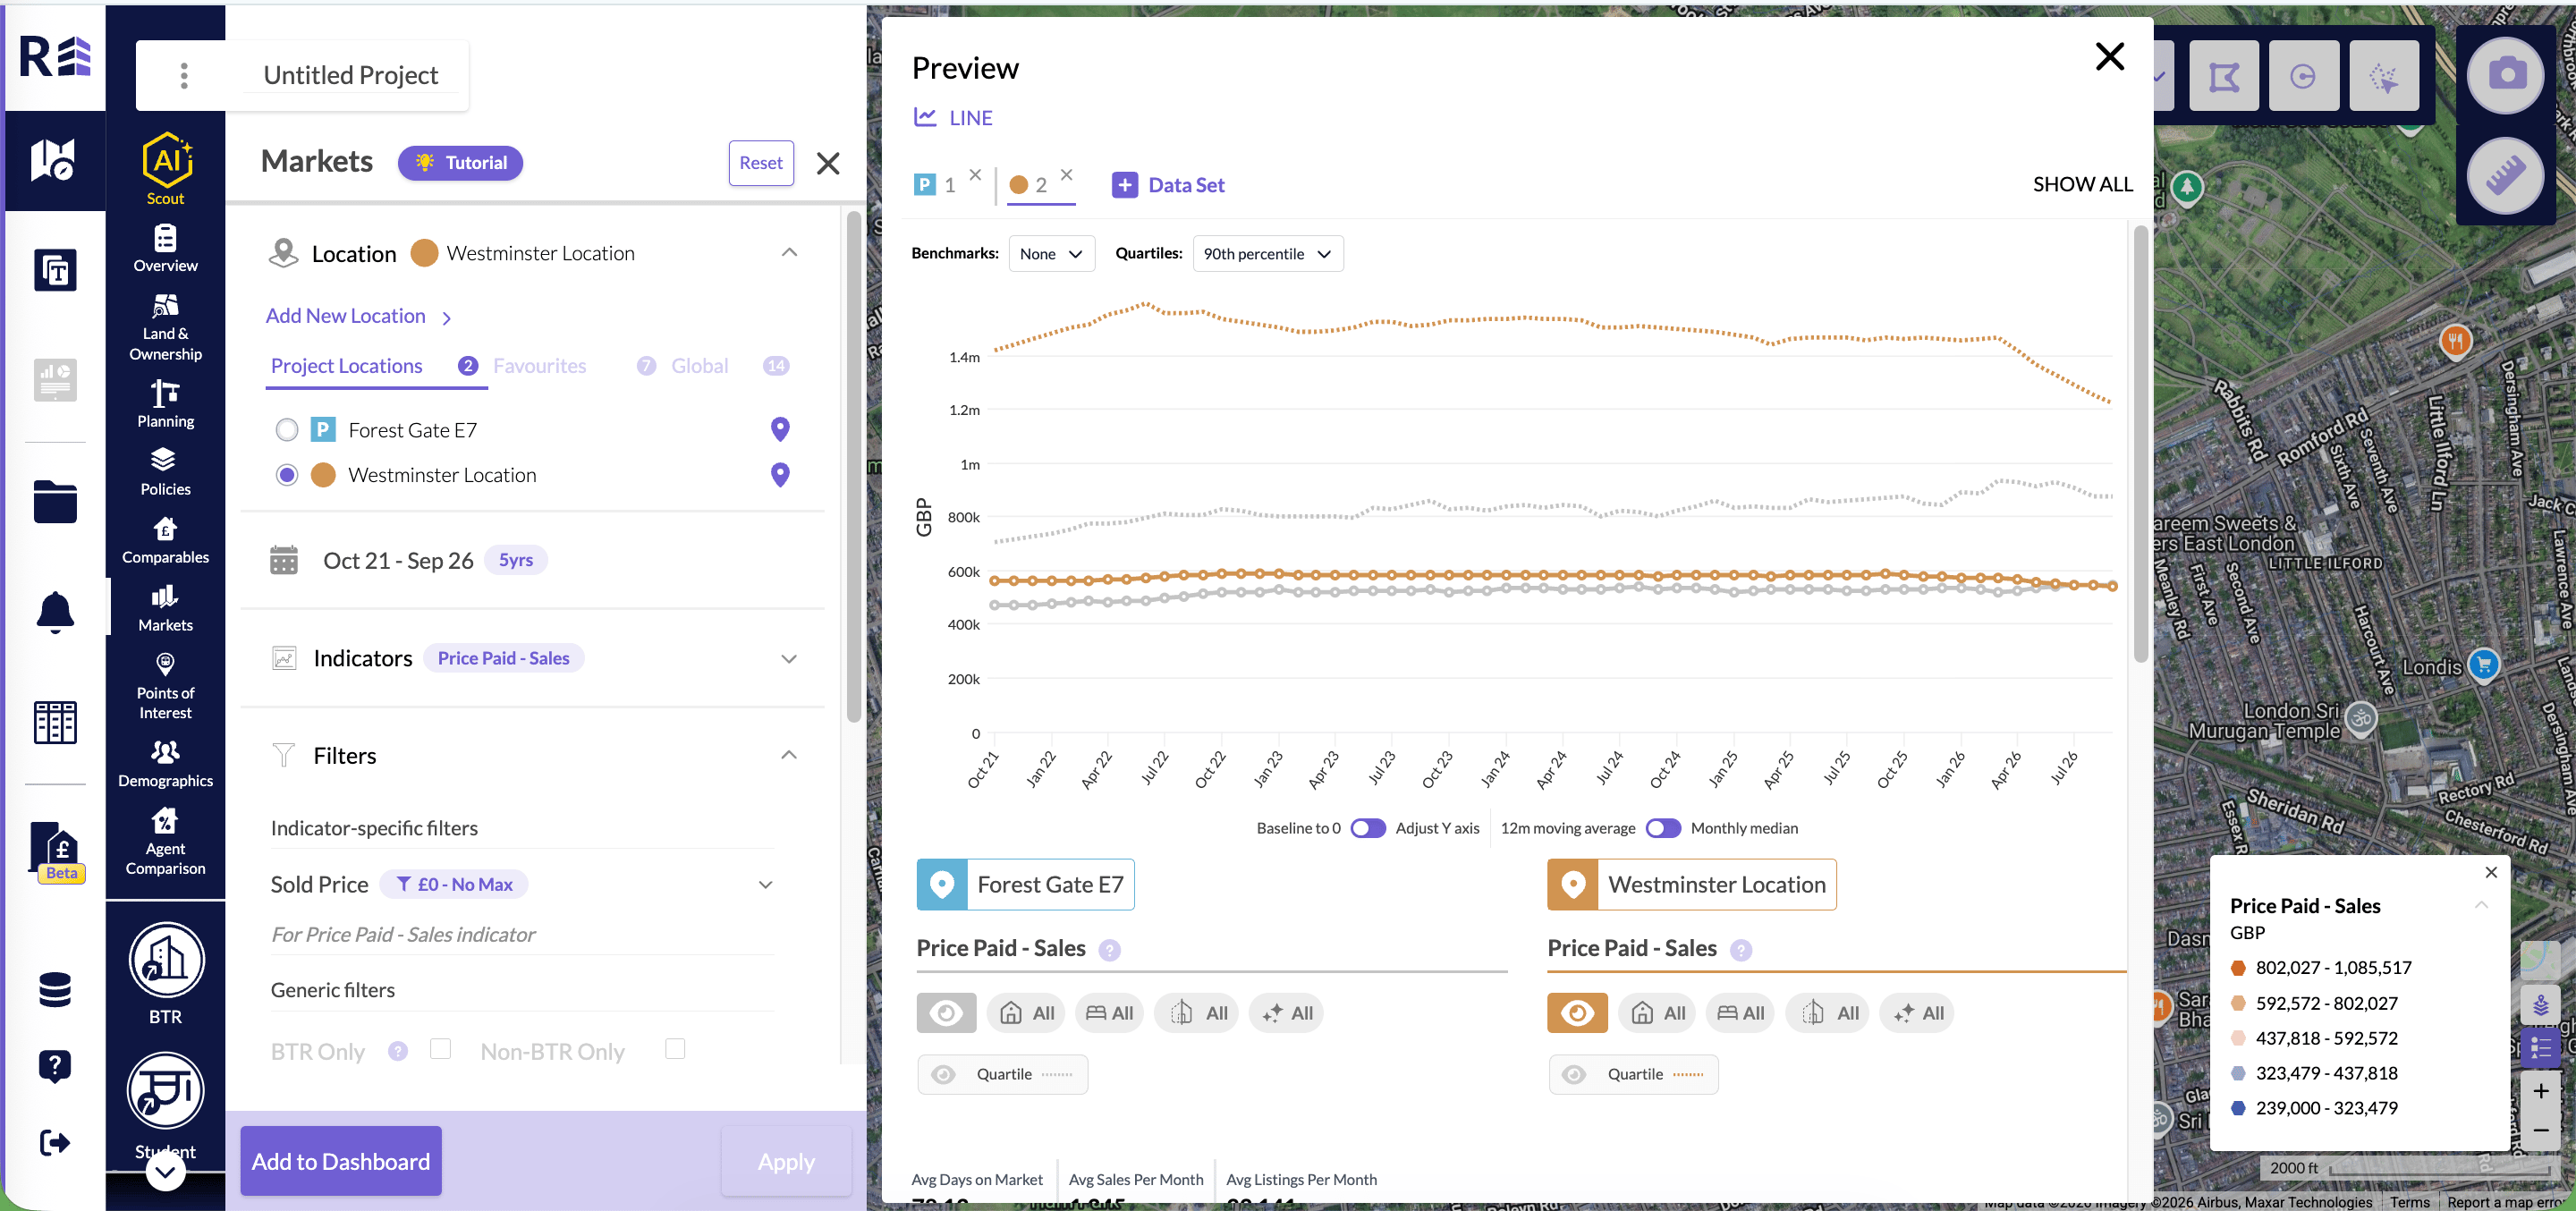
Baseline to 0
The Baseline to 0 toggle changes the Y axis from zero to the lowest value in the results. This makes trend patterns easier to see.12 month moving average and monthly median
- 12 month moving average: Averages the previous 12 months to smooth the trend line, so you can see how the market is moving.
- Monthly median: The middle value for that month, when all values are put in order.
Benchmarks
A benchmark is a reference point to compare your results against in a graph. There are two options:- National: Compares your results with the average for the whole of the UK.
- Regional: Compares your results with the wider region you are searching in, such as the East of England.
Quartiles
A quartile splits the data into parts, so you can see where your results sit across the full range. For example, if you are looking for lower-value houses, add the 25th percentile to see how your search area compares at the 25% mark of house prices.Heatmaps
Select one sales indicator at a time, so the heatmap shows the data clearly. The heatmap reflects the filters you select, so you can build one for a single property type, a number of bedrooms and more.Save a heatmap to your dashboard
- Select your sales indicator and click Apply.
- When the heatmap appears, click the camera icon in the top right corner of the platform.
- Take a screenshot of the map and add it to the section of your dashboard you want.